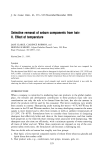
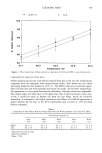
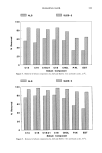
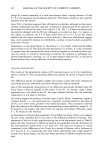
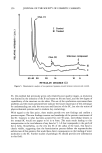
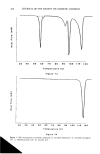
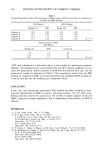
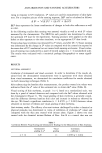
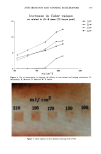
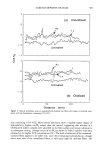
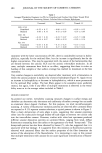
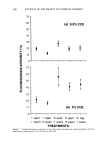
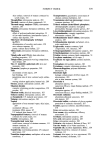
388 JOURNAL OF THE SOCIETY OF COSMETIC CHEMISTS z z z o 70 60 50 4O 30 20 10 0 '70 60 50 40 (a) 0.5% CCE I [ [ • I ' I ' I 3O 2O 10 (b) 2% CCE I ' I ' I ' I ' I ' I appl. I appl. 5 appl. 5 appl. 2. tag I wash 5wash I wash 5wash I wash TREATMENTS Figure 7. Average fluorescence intensities of hair fibers after treatment and rinsing procedures with the formulations containing (a) 0.5% CCE and (b) 2% CCE.

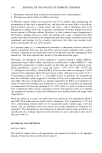
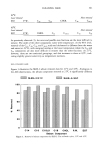
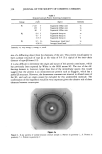
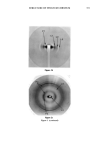
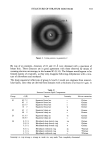
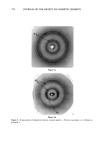
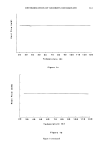
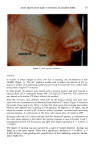
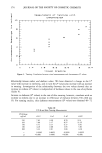
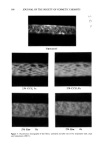
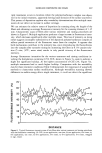
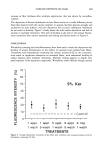
SURFACE DEPOSITS ON HAIR 389 increase in film thickness after multiple applications that was shown by microfluo- rometry. The deposition of keratin hydrolysate on hair fibers results in a totally different picture from that observed with the cationic polymer. It appears that Ker deposits strongly and exclusively on scale surfaces, and once deposition has occurred, subsequent treatments do not result in buildup. Figure 5 clearly shows the scale surface deposition and lack of increase in multiple treatments. This lack of buildup is also seen in the average fluores- cence intensities after various treatment and rinsing procedures shown in Figure 8. CONCLUSIONS Wettability scanning and microfluorometry have been used to study the deposition and buildup of several formulations on the surface of untreated and oxidized hair fibers. Treatments with formulations containing the cationic polymer CCE in two concentra- tions result in significant adsorption on untreated fibers, with substantial buildup of surface deposits after multiple treatments. Multiple rinsing appears to desorb only small amounts of the deposited compounds. Wettability shows definite though uneven 7O 6O 5O 4O 3O 5% Ker ILl LIJ 20 LIJ 10 n- Control 0 :D 0 I ' , ' , ' , ' ' ' ß 'J I appl. I appl. 5 appl 5 appl 2. tag I! ' ' I wash 5wash I wash 5wash I wash TREATMENTS Figure 8. Average fluorescence intensities of hair fibers after treatment and rinsing procedures with the formulation containing 5 % Ker.
Purchased for the exclusive use of nofirst nolast (unknown)
From: SCC Media Library & Resource Center (library.scconline.org)