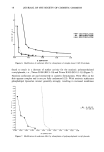
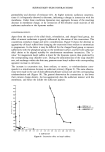
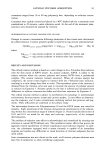
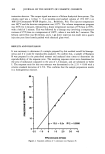
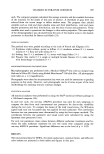
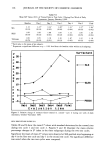
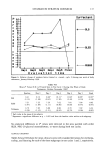
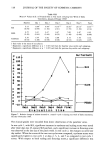
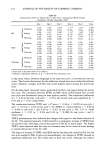
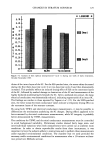
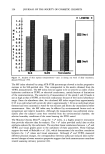
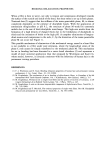
CHANGES IN STRATUM CORNEUM 113 Table III Mean Electrical Conductance (S.D.) of Treated Sites in Test Cycle 1 During One Week of Daily Treatments, October-November 1989' Baseline Day 1 Day 2 Day 3 Day 4 Day 5 Final 41 71 41 21 1811'2 2121 01'2 SLS (12) (3) (4) (2) (91) (94) (1) 48 251 121 101 8 • 6 • 29 SLES (14) (8) (6) (6) (4) (3) (10) 45 231 261 261 231 241 26 Tallowate (8) (8) (4) (9) (10) (6) (12) * Each value is the mean of six subjects measured in microSiemans. 1 Represents a significant difference at p = 0.05 level from the baseline value within each subgroup. 2 Represents a significant difference at p = 0.05 level from the previous day within each subgroup. Table IV Mean Electrical Conductances (S.D.) of Treated Sites in Cycle 2 During One Week of Daily Treatments, January-February 1990' Baseline Day 1 Day 2 Day 3 Day 4 Day 5 Final 35 21 31 851,2 302 •'2 3021 01,2 SLS (10) (2) (4) (50) (138) (143) (0) 30 141 91 71 71 81 20 SLES (9) (6) (7) (5) (4) (3) (7) 32 21 24 18 23 20 31 Tallowate (12) (9) (10) (7) (9) (8) (13) * Each value is the mean of six subjects measured in microSiemans. 1 Represents a significant difference at p = 0.05 level from the baseline value within each subgroup. 2 Represents a significant difference at p = 0.05 level from the previous day within each subgroup. one, two, and three days of SLS treatment. This was followed by a marked increase in electrical conductance on day 4, which continued through day 5. After the weekend rest period, the electrical conductance dropped precipitously to approximately that observed on days 1, 2, and 3. With both SLES and PEG-20 glyceryl monotallowate, significant decreases in electrical conductance were recorded throughout the patch period when compared with the pretest baseline values. However, after the weekend rest period, the values were no longer significantly different from the baseline values. No significant changes from the pretest values were observed in the control sites. Data from test cycle 2 showed changes similar to those observed during the first test cycle for the SLS and SLES subgroups. However, no significant difference was noted in sites treated with PEG-20 glyceryl monotallowate during this test cycle. The only difference noted between the two test cycles was that the marked increase in the SLS-treated subgroup occurred one day earlier. The control sites again showed no significant changes throughout the test cycle, confirming the consistency and repro- ducibility of the test procedure. The relative changes in electrical conductance shown in Figure 4 further emphasize the greater degree of change in the SLS subgroup during this winter test cycle as compared with that in test cycle 1 (Figure 3).

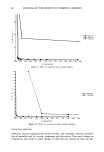
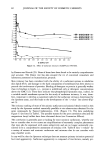
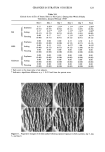
114 JOURNAL OF THE SOCIETY OF COSMETIC CHEMISTS Surfacan BOO 700 BOO o SLS 500 400 aO0 x SLES 200 io0 o -•00-- • PEG20 Dayi DayE Day3 Day4 Day5 Final Evaluation time Figure 3. Relative change of electrical conductance (treated vs. controlcycle 1) during one week of daily treatments, October-November 1989. MOISTURE FACTOR (MF) INDEXES BY FTIR SPECTROSCOPIC MEASUREMENT Tables V and VI show mean MF indexes with standard deviations for treated sites during test cycles 1 and 2, respectively. An increased MF index value suggests an increase in the water content of the stratum corneum. Figures 5 and 6 illustrate the corresponding mean relative percentage changes. In both test cycles, MF indexes obtained from SLS-patched sites were significantly increased when the test day's values were compared with the pretest values. The results from the two test cycles were similar, and no significant differences were noted between the two test cycles. No statistically significant differences were observed in SLES or PEG-20 glyceryl monotallowate-patched sites either within the same test cycle or between the two test cycles. SKIN ERYTHEMA INDEX (+ a*) Tables VII and VIII show the mean + a* values with standard deviations for SLS, SLES, and PEG-20 glyceryl monotallowate-treated sites during test cycles 1 and 2. Figures 7 and 8 illustrate the mean relative percentage changes during the two test cycles. No statistical differences in a* values were detected in test sites exposed to either SLES or PEG-20 glyceryl monotallowate during both test cycles.
Purchased for the exclusive use of nofirst nolast (unknown)
From: SCC Media Library & Resource Center (library.scconline.org)