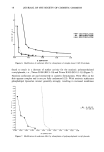
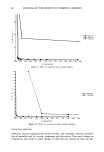
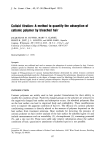
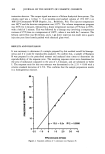
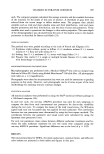
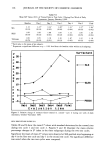
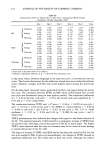
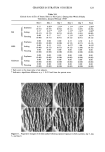
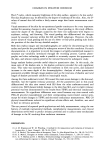
CHANGES IN STRATUM CORNEUM 115 Surfactant tt00- iooo 900 o SLS BOO 700 600 500 400 • SLES 300 200 ioo o - iO0 • ß PEG20 Dayi Day2 Day3 Day4 Day5 Final Evaluation Figure 4. Relative change of electrical conductance (treated vs. control-•cycle 2) during one week of daily treatments, January-February 1990. Table V Mean MF Values (S.D.) of Treated Sites in Test Cycle I During One Week of Daily Treatments, October-November 1989' Baseline Day 1 Day 2 Day 3 Day 4 Day 5 Final 1.05 1.15 1.24 • 1.391 1.38 • 1.411 1.14 SLS (0.04) (0.06) (0.09) (0.09) (0.05) (0.02) (0.04) 1.10 1.09 1.15 1.16 1.15 1.14 1.13 SLES (0.03) (0.05) (0.03) (0.05) (0.04) (0.03) (0.02) 1.09 1.07 1.11 1.10 1.13 1.10 1.12 Tallowate (0.03) (0.03) (0.03) (0.03) (0.05) (0.04) (0.02) * Each value is the mean of six subjects. 1 Represents a significant difference at p = 0.05 level from the baseline value within each subgroup. Gradual increases of + a* values were observed in all SLS-patched sites in both test cycles. In test cycle 1, a statistically significant increase was noted at day 3, while in test cycle 2, a significant difference was observed a day earlier. The control sites for both cycles showed no significant differences from the pretest mean values. As shown in Figures 7 and 8, the relative changes in + a* caused by SLS were greater in test cy- cle 2.

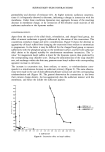
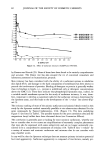
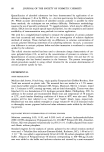
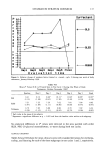
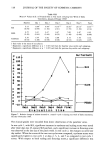
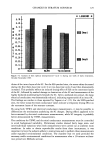
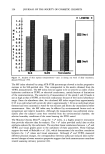
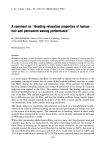
116 JOURNAL OF THE SOCIETY OF COSMETIC CHEMISTS Table VI Mean MF Values (S.D.) of Treated Sites in Test Cycle 2 During One Week of Daily Treatments, January-February 1990' Baseline Day 1 Day 2 Day 3 Day 4 Day 5 Final 1.13 1.22 • 1.24 • 1.26 • 1.31 • 1.37 • 1.04 • SLS (0.03) (0.04) (0.05) (0.06) (0.04) (0.05) (0.02) 1.08 1.08 1.08 1.09 1.11 1.09 1.09 SLES (0.03) (0.02) (0.02) (0.02) (0.04) (0.05) (0.04) 1.08 1.05 1.10 1.10 1.07 1.12 1.10 Tallowate (0.05) (0.03) (0.03) (0.03) (0.02) (0.02) (0.06) * Each value is the mean of six subjects. 1 Represents a significant difference at p = 0.05 level from the baseline value within each subgroup. p Supfactant e 35-- P c 3o-- o SLS e •5-- n i: 2o-- g t5-- t0 -- e---- • :SLES c h 5' n o g e -5 - - i PEI•20 Dayt Day2 Day3 Day4 Day5 Final Evaluat:lon time Figure 5. Relative change of moisture factor (treated vs. control-•cycle 1) during one week of daily treatments, October-November 1989. SKIN BRIGHTNESS INDEX (L*) Tables IX and X show the mean L* values with standard deviations for the treated sites during test cycle ! and test cycle 2. Figures 9 and 10 illustrate the mean relative percentage changes in L* index in the three subgroups during the two test cycles. Significant decreases of mean L* values were observed at SLS-patched sites beginning at day 4 in the first test cycle and day 3 in the second test cycle. No significant difference was noted when the two test cycles were compared.
Purchased for the exclusive use of nofirst nolast (unknown)
From: SCC Media Library & Resource Center (library.scconline.org)