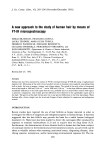
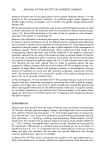
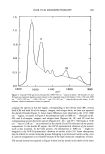
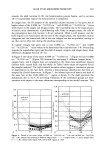
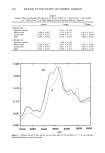
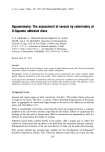
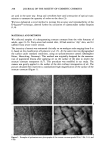
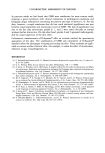
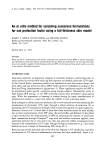
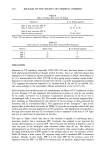
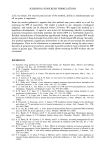
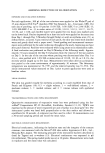
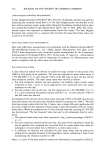
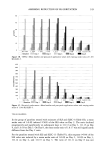
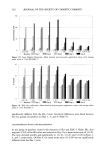
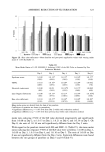
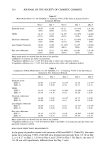
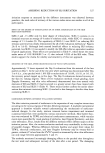
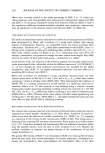
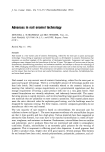
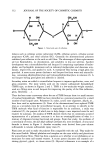
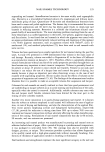
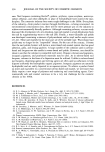
288 JOURNAL OF THE SOCIETY OF COSMETIC CHEMISTS ANAGEN CATAGEN TELOGEN c• o • N Central bulb :•,•-_- - • Inferiof•.:•- :_ ?i• _--..--_-• IJ[J-Ib "--• matrix epithelial column hair club Figure 1. Schematic diagrams of anagen, catagen, and telogen hair bulbs. Numbers show the microareas analyzed. epithelial sac is sometimes left within the follicle in this case, it is difficult to distin- guish the hair phase. Hairs in the three phases of their cycle have been examined by means of FT-IR mi- crospectroscopy (FT-IR-M) using a high pressure diamond cell. In Figure 2 the infrared spectrum in the 1800-950 cm- 1 region is shown. It appears that the intensity of Amide I bands is too high (A = 1.5 units) and can give rise to non-linear effects. The Amide II bands in all samples is below the correct absorbance limit of 1 unit (0.7-0.9 absor- bance units). Nevertheless, since the intensity values of Amide II bands are too high --1 with respect to the absorptions localized in the 1480 and 950 cm range, in order to

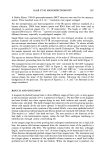
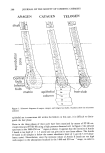
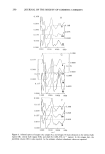
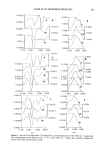
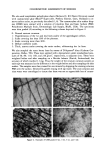
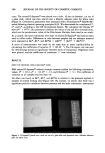
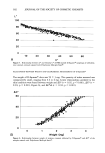
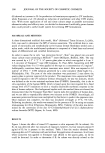
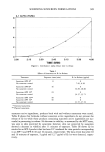
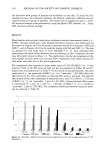
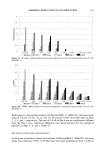
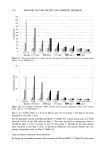
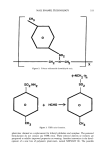
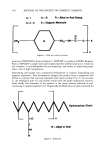
HAIR FT-IR MICROSPECTROSCOPY 289 1.5 1.2 - 0.9- 0.6- 0.3 0.0 1800 i I I II 1600 III 14oo 12oo 950. cm-I Figure 2. Typical FT-IR spectrum of human hair (1800-950 cm- • region) is shown. The Amide I, II, and III bands are indicated baseline points relative to the integrated areas of the bands at 1540, 1238, and 1080 cm -• (1475-1495 cm-1, 1300-1185 cm-•, and 1137-997 cm -•, respectively)are also shown. In the ordinate, absolute absorbance values are reported. compare the spectra in this last region, corresponding to the inferior bulb (IB), central bulb (CB) and shaft (S) of the ariagert, catagen, and telogen hairs, we have not reported the Amide II bands (Figure 3). Since major differences were observed in the ! !30-!000 --1 1 cm region, we report in Figure 4 the absorption band at !080 cm- obtained on IB, CB, and S of anagen, catagen, and telogen hairs (Figures 4A, 4C, and 4T) and the corresponding second derivative spectra (Figures 4A', 4C', and 4T'). The bands at !540 --! cm and at !238 cm are attributed to the Amide II and III vibrations of the proteic components. In the Amide III region, the O-P-O asymmetrical vibration of the nucleic acids is also localized. In the bulb portion, the absorptions at !080 cm-! might be assigned to the O-P-O symmetrical vibration of nucleic acids (!4). Some absorptions may be related to certain molecular groups belonging to proteins and nucleic acids, even if a precise assignment is not feasible because of the high molecular complexity of hairs. The second derivatives reported in Figure 4 show similar trends in the shafts of the three
Purchased for the exclusive use of nofirst nolast (unknown)
From: SCC Media Library & Resource Center (library.scconline.org)