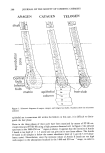
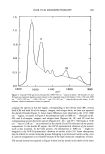
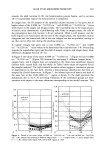
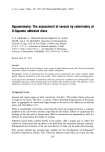
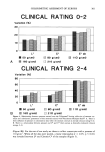
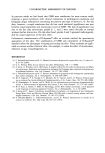
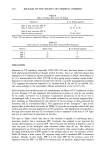
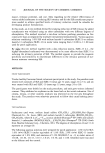
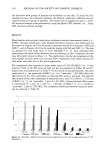
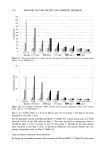
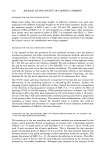
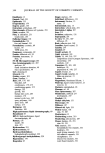
290 JOURNAL OF THE SOCIETY OF COSMETIC CHEMISTS 0.084 0.000 0.179 0.090 O. 168 _ ! o.ooo 14,•o 1300 1 ooo 950 -•'cx- --• o. 148 i•_j o.o74 0.179 --- • 0.099 S• 0.176 .... 0.000 0.234 {/• l•- I 0.000 l__•__ .l 0.088 • EC• i 1480 1300 1000 950 0.229 0.115 0.000 0.157 0.079 0.000 I I 0.196 0.098 0.000 1480 1300 1000 950 Cil1-[ Figure 3. Infrared spectra of anagen (A), catagen (C), and telogen (T) hairs obtained on the inferior bulb region (IB), central bulb region (CB), and shaft (S) (1480-950 cm- • region). In the catagen hair, the _epithelial column (EC) is also reported. In the ordinate, absolute absorbance values are reported.

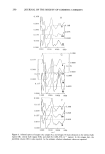
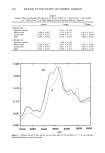
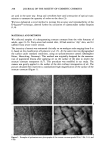
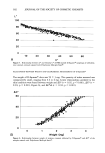
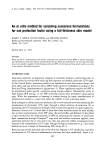
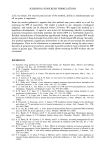
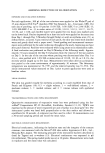
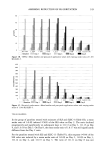
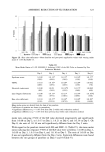
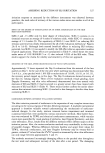
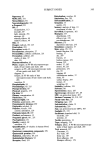
HAIR FT-IR MICROSPECTROSCOPY 291 0.0028 -0.0023 -0.0075 0.0059 0.0018 -0.0009 -0.00:•5 1130 1100 1050 -0.0071 -0.0201 lOOO o.oo C' •'- -0.0015 __ -0.0052 \ , 0.0027 -0.0021 .-O.00G8 i 1130 0.0037 -0.0018 -0.0073 1 lOO 0.0035 -0.0008 1050 1000 lB • 0.003• -0.001G -0.0052 -0.0065 _ z z 1130 1100 1050 1000 Clll- I Clll- l 0.045 --- A 0.023 $ -- 0.000 0.056 --- CI 0.028 0.000 1140 1050 1000 0.032 0.016 0.000 ...... 0.062 c 0.100 0.031 _ 0.000 ø'ø5ø I/•-•l 0.096 0.000 L___,• ...... '•---• 0.043 0.186 [-//• i• 0.093 I/ ...... '••- o.ooo o.ooo r... 1140 1050 1000 0.048 [-----/• .T' 0.024 •/ //•---•- ] 0.034 0.000 t-/• .... x•_ _x• 0.017 0.032[ .... -••- 0.000 0 000 I , 1140 1050 1000 Figure 4. Spectra of (A) anagen hair, (C) catagen hair, and (T) telogen hair (1140-1000 cm- 1 region) and the corresponding second derivatives (A', C', T') (! 130-1000 cm-1 region). EC, epithelial column IB, inferior bulb CB, central bulb S, shaft.
Purchased for the exclusive use of nofirst nolast (unknown)
From: SCC Media Library & Resource Center (library.scconline.org)