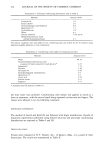
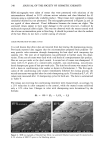
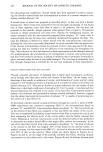
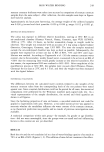
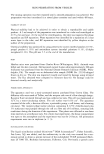
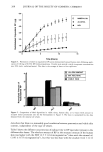
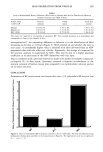
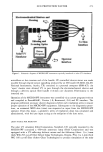
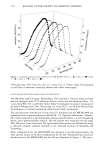
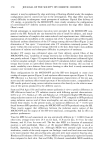
266 JOURNAL OF THE SOCIETY OF COSMETIC CHEMISTS The effect of the surfactant on hairless mouse skin was evaluated using water flux as an indicator of damage. The donor compartment was left open and empty during 6 and 12 hours, then tritiated water was applied in the donor phase and its permeation was monitored in the receptor phase. Water fluxes were slightly higher for skin treated for 12 hours with polysorbate 80 compared to preserved saline, which may indicate a slight damaging effect of the surfactant (Figure 2). Hairless mouse skin freshly excised showed a very slight decrease in water permeation at 12 hours compared to 6 hours. The reason is not clear at this time, but the effect of the salt on the excised skin may be responsible for a modification of barrier properties. RP PERMEATION THROUGH HAIRLESS MOUSE SKIN The permeation of RP across hairless mouse skin from 50-mg samples of 0.05% RP (w/w) formulations (25 •g RP total) into a 3% polysorbate 80 receptor was followed during a 12-hour period. The receptor phase analyzed by HPLC after extraction did not contain RP. As was mentioned earlier, the radioactivity recovered in the receptor was a degradation compound or metabolite of RP. The mass balance of the radiolabeled component averaged 93% of the original dose applied. Most of the radiolabeled com- pound (an average of 80%) was recovered during the cleaning of the donor phase. The permeation profiles of RP across HMS showed a slight increase in permeation of the label with neutral and positive NSV formulations, compared to the control, mineral oil. With negatively charged NSV (Figure 3), appearance of the label in the receptor followed the mineral oil pattern with slightly lower values. All of the preparations E 10 o E 0 i /• Exposed 6 Hours to Preserved Saline ß Exposed 12 hours to Preserved Saline [] Exposed 6 Hours to Polysorbate 80 ß Exposed 12 Hours to Polysorbate 80 ß i ß i ß i i i - , ß i I 2 3 4 5 6 7 Time (Hours) Figure 2. Permeation of radiolabeled (•H) water across freshly excised hairless mouse skin after exposure to preserved saline or to a 3% solution of polysorbate 80 for 6 hours and 12 hours.

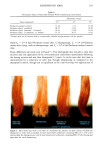
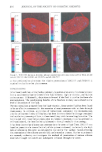
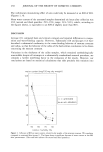
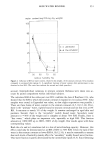
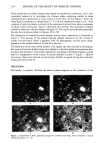
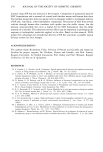
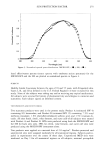
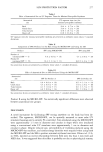
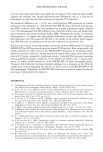
SKIN PERMEATION FROM VESICLES 267 1.5 1.0 0.5 0.0 [] [] [] [] [] [] [] 0 i [] MO [] NEUTRAL [] POSITIVE [] NEGATIVE Time (Hours) Figure 3. Permeation of label (as equivalent RP) across freshly excised hairless mouse skin following application of 50 mg of 0.05% RP (w/w) preparations. Charge of vesicles is indicated vesicle component concentration was 20% (w/w: surfactant/water). Error bars are smaller than the symbols (n = 3). All amounts of radiolabeled compound permeated at 12 hours from vesicular systems are significantly different from mineral oil (Student t-test, P 0.05). contained RP at a concentration of 0.05% in the donor phase, and the total amount of label permeated did not exceed 6% of the dose applied. The penetration pattern was unusual in that the slope of the curve was highest at earliest times and gradually decreased. This type of release curve is characteristic of a compound that diffuses from a matrix. One interpretation is that RP enters the stratum corneum rapidly but that the label is characterized by a slower release into the underlying aqueous tissues. These hydrophilic tissues constitute the rate-limiting steps for permeation. RP PERMEATION THROUGH HUMAN SKIN Figure 4 shows label penetration through excised human skin. As with the studies involving hairless mouse skin, the concentration of RP was 0.05%, but the dose applied was 100 mg of formulation (50 pig of RP). The mass balance of radioactivity averaged 90%. The distribution of radiolabeled material showed that most of the radioactivity was recovered with the washing of the donor compartment (84%). However, the profiles are quite different: The plot for permeation from neutral NSV is linear. The other curves, for alcohol and mineral oil, exhibited an initial linear section. Unlike the case with hairless mouse skin, label permeation from mineral oil was considerably greater than from the NSV preparation. Alcohol produced the most rapid penetration of all. Several permeation parameters for the three vehicles are compared in Figure 5. With the mineral oil data as a reference point, relative values of viable skin content, skin pene- tration at 12 hours, and the initial penetration rate for the other vehicles are shown. The
Purchased for the exclusive use of nofirst nolast (unknown)
From: SCC Media Library & Resource Center (library.scconline.org)