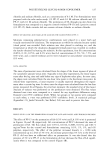
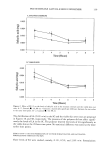
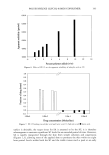
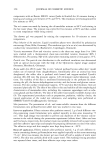
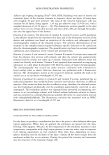
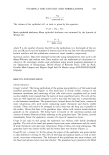
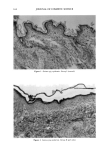
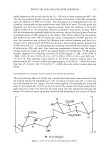
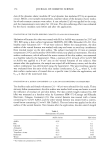
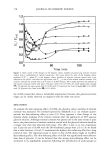
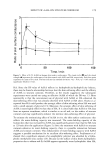
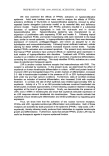
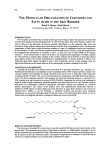
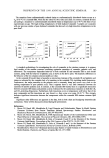
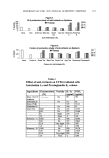
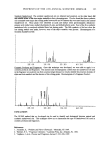
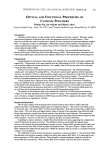
POLYETHYLENE GLYCOL-8/SMDI COPOLYMER 137 chloride and sodium chloride, each at a concentration of 0.1 M. Two formulations were prepared with the salts under study: 3% PP-15 with 0.1 M calcium chloride and 3% PP-15 with 0.1 M sodium chloride. The permeation of SA through pig skin from. two formulations was compared to a negative control (without PP-15) and a positive control (3% PP-15). Both controls did not contain calcium chloride or sodium. chloride. EFFECT OF SALICYLIC ACID AND LACTIC ACID ON THE CLOUD POINT OF PP-15 Solutions containing polymer/active combinations were placed in a water bath and visually monitored for cloudiness. The temperature at which the solution became turbid (cloud point) was recorded. Each solution was then placed in melting ice, and the temperature at which the cloudiness disappeared (cloud point) was recorded to confirm the results obtained by heating the solution. In this experiment, four SA concentrations (0.05%, 0.1%, 0.15%, and 0.2% w/w), four LA concentrations (2.5%, 5%, 7.5%, and 10% w/w), and a control (without active) were evaluated at one polymer concentration (3% w/w). DATA ANALYSIS The rates of permeation were calculated from the slopes of the linear regions of plots of the cumulative amount versus time. Typically in low-dose experiments, the linear region starts after the lag time and ends before any sign of depletion takes place. In most cases, the slopes were calculated from the one-hour time point to the four-hour time point. In infinite-dose experiments, a linear response is usually expected throughout the experi- ment after a certain lag time. In these cases the slopes were calculated from the last four points measured. (In all figures, the error bars represent the standard error of the mean.) Analysis of variance was performed on the permeation rates obtained. The flux values obtained over time were compared to a control for any significant differences using Dunnett's test (95% confidence level). When two groups or two points were compared to each other, a t-test was performed (95% confidence level). A statistical package (SigmaStat 2.0, Jandel Scientific, San Rafael, CA) was used to process the data. RESULTS EFFECT OF PP-15 ON THE PERMEATION OF SALICYLIC ACID AND LACTIC ACID THROUGH PIG SKIN The effect of PP-15 on the permeation of SA (0.5% w/w) and LA (5% w/w) is presented in Figures 1A and lB, respectively. All concentrations of PP-15 decreased the rates of permeation of SA. The flux values were 0.5514, 0.4314, 0.2885, 0.0170, and 0.0171 mg/cmi/hour for the control and formulations containing 0.3%, 1%, 3%, and 6% polymer, respectively. The effect of the polymer increased linearly (r -- 0.98) with concentration up to a level of 3% w/w. An increase greater than 3% w/w in the level of PP-15 did not have an additional effect on permeation. It was also found that the presence of 3% w/w PP-15 in the formulation did not decrease the flux of LA signifi- cantly when it was compared to the control (Figure lB).

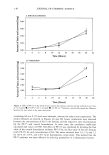
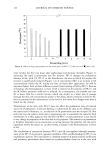
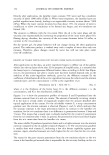
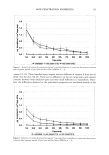
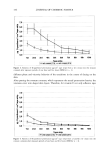
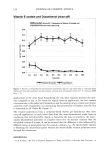
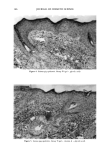
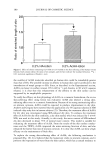
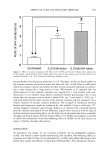
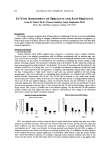
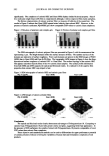
138 JOURNAL OF COSMETIC SCIENCE A. SALICYLIC ACID 0.4 Li .1 0.0 0 2 4 6 8 10 Time (Hours) B. LACTIC ACID 2.0 0 5 10 15 20 25 30 Time (Hours) Figure 1. Effect of PP-15 on the permeation of salicylic acid and lactic acid through pig skin. A: ¸, Control •, 0.3% PP-15' ', 1% PP-15 O, 3% PP-15 ', 6% PP-15. B: C), Control O, 3% PP-15. EFFECT OF PP-15 ON THE UPTAKE OF SALICYLIC ACID AND LACTIC ACID IN PIG SKIN The distribution of SA (0.5 % w/w) in the SC and the viable skin over time are presented in Figures 2A and 2B, respectively. The levels of SA recovered in the SC were highest at the two-hour time point then decreased over time. A trend can be noticed in Figure 2A where the presence of the polymer increased the levels of SA in the SC. A statistical significance was obtained only at the four-hour time-point (Figure 2A) when each time point was evaluated independently. When the overall amount of SA deposited in the SC was evaluated, a significant increase in SA deposition was obtained in the presence of the polymer. The polymer did not change significantly the levels of SA in the viable skin (Figure 2B). The levels of SA in the viable skin were highest at the two-hour time point, and then decreased steadily over time. This behavior corresponded to the pattern ob- served for the flux values of SA through the skin from the same formulations.
Purchased for the exclusive use of nofirst nolast (unknown)
From: SCC Media Library & Resource Center (library.scconline.org)