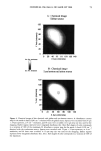
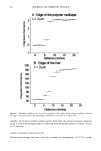
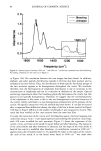
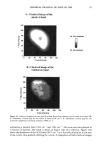
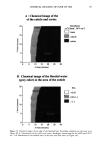
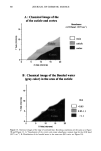
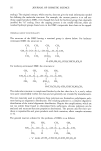
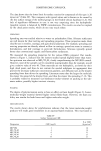
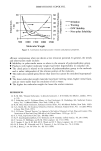
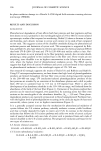
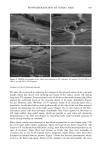
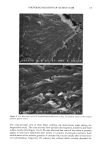
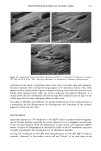
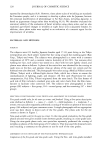
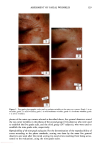
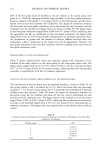
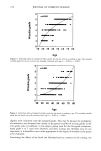
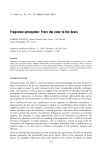
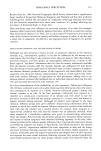
CHEMICAL IMAGING OF HAIR BY IMS 85 A: Chemical Image of the amide A band 120 100 • 8O • 40 2O 0 20 40 60 80 100 120 X Axis (microns) lnt. Abs. maximum :. •.-• Int. Abs minimum B: Chemical image of the sulnhonate band 120 100 -- . _ ... .-. 8O T= 60 • 40 2O 0 ! o do 8o X Axis (microns) Figure 10. Chemical images of the hair after bleaching. Recording conditions are the same as in Figure 4B. A: Absorbance contour map for the amide A band (3290 cm-•). B: Absorbance contour map for the symmetric sulphonate stretching vibration (1040 cm-•). subtracting a baseline from 3702 cm -• and 3102 cm -•. This ratio was then plotted as a function of position. The result is shown in Figure 12B. As a reference, Figure 12A shows the absorbance of the vCH band (2875 cm -•) as a function of position in the area of the cuticle, thus spatially defining the cuticle. A comparison of both chemical images

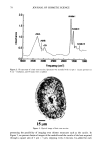
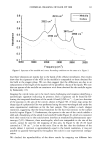
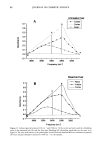
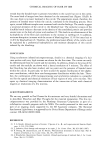
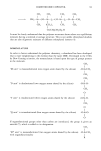
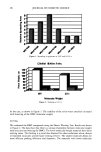
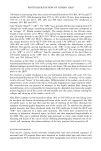
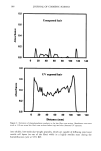
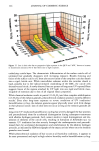
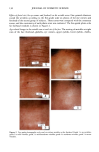
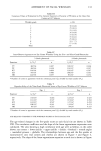
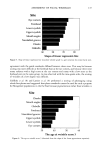
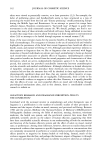
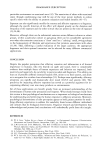
86 JOURNAL OF COSMETIC SCIENCE 0.7 0.6 0.5 0.4• 0.3' 0.2- 0.1-' 0.0- -0.1 Untreated hair z• = CuUcle - --o-- Resin A./ 36'00 35'00 34'00 '33'00 32'00' Frequency (crn '•) Bleached hair 0.7 0.6 0.5 0.4 0.3 0.2 0.1 0.0 -0.1 Resin Cuticle x N 3600 3500 3400 3300 3200 Frequency (cm '•) Figure 11. Infrared spectra between 3102 cm ] and 3700 cm •of the cuticle and cortex and the embedding resin of the untreated hair (A) and the hair after bleaching (B). Recording conditions are the same as in Figure 8. The ratio A/B relative to the peak height A and B with the baseline MN was calculated to quantify the water amount (shoulder centered at 3400 cm -z) in the samples.
Purchased for the exclusive use of nofirst nolast (unknown)
From: SCC Media Library & Resource Center (library.scconline.org)