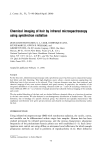
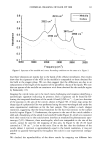
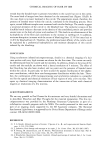
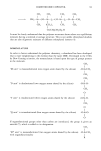
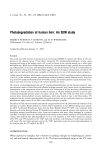
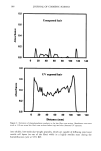
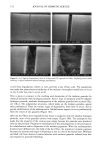
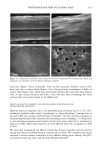
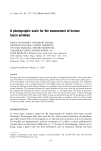
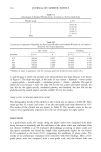
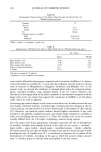
CHEMICAL IMAGING OF HAIR BY IMS 75 approximately 10 cm from the root. Then these were embedded into epoxy resin and sliced with a microtome to yield cross sections 6-pm thick. The polymer was chosen to have spectral features that overlapped minimally with those of the hair sample. INFRARED MICROSPECTROSCOPY EXPERIMENTS The infrared data were obtained with a commercial IR microspectrometer (Spectra-Tech "Irps TM) installed at beamline U4IR (16,17) at the National Synchrotron Light Source, Brookhaven National Laboratory (USA). The high-brightness infrared synchrotron radiation (IRSR) was extracted from the elec- tron storage ring using special high-aperture f/10 optics, and a collimated beam of 2-cm diameter was fed into the IrpS microspectrometer system. A schematic of the Irps microspectrometer is shown in Figure 1. The IrpS system consists of an integrated FTIR spectrometer and a microscope optical module. The spectrometer is equipped with a rapid-scan Michelson interferometer with a Germa- nium-coated KBr beam splitter and a mercury cadmium telluride (MCT) infrared de- tector. A 32X, 0.65 numerical aperture (NA) objective and 10X, 0.71 NA condenser were in a confocal arrangement for the transmission measurements. For our measure- ments, apertures were placed both before and after the sample to confine the infrared beam to a particular region of interest in the specimen and to provide maximum rejection of stray light, as shown by Sommer and Katon (9). The aperture sizes quoted in this paper are those defined at the sample, taking account of the appropriate demag- nification of objective and condenser. Spectra were collected between 4000 and 900 cm- • at a resolution of 4 ø cm-•. Infrared Sample on stage X-Y Lower a• Illuminator : sour•3e Upper aperture '•" "• ...... .•.•:" '•"•'•••••iii • .::. :' •7 ••e•spl Detor Figure 1. Schematic diagram of the I•s scanning infrared microsp•trometer.

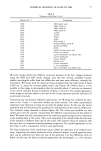
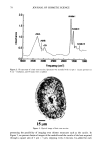
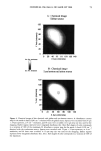
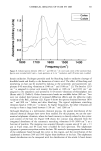
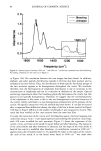
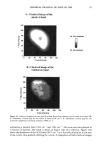
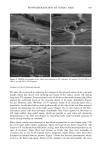
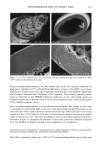
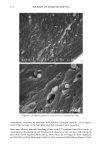
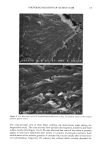
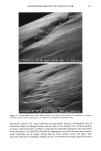
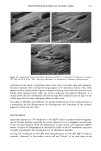
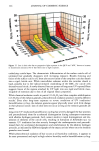
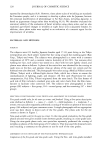
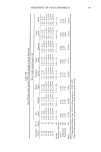
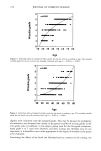
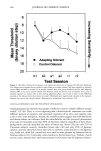
76 JOURNAL OF COSMETIC SCIENCE imaging was achieved by raster scanning the sample across the microfocused IR beam, taking a complete spectrum at each point. A two-dimension motorized sample stage was used for this raster scanning. The spatial resolution was controlled by the aperture size, except for very small apertures, when the resolution is limited by diffraction to a value comparable to the wavelength. For the synchrotron source measurements, the total area that can be rastered and mea- sured ("mapped") is somewhat controlled by the fact that an uninterrupted synchrotron beam is available for a period of about four hours. In principle, this could be extended by pausing the measurement for the five minutes needed to "re-fill" the synchrotron ring with electrons. Still, map sizes up to 20 x 20 (i.e., 400 spectra) can be collected in this way. Following conventional procedures, each spectrum was ratioed to a reference spec- trum to remove instrumental artifacts and yield the specimen's transmission. The data was then converted into absorbance units by taking the negative logarithm. We note that the synchrotron source intensity gradually decays during the time period for col- lecting the map spectra. This results in a gradually increasing baseline shift for the absorbance spectra, which is readily corrected by performing a linear baseline subtraction on each spectrum. Then, from these data, a map of the integrated absorbance of a specific frequency was built up. In comparison, experiments were also performed using the instrument's standard globar source. A total of 64 spectrometer "scans" (collection time of 30 seconds) were co-added at a given location to improve signal-to-noise ratio. The infrared flux reaching the detector, and therefore the signal-to-noise ratio, decreases with aperture size. The prac- tical lower limit for apertures was found to be 24 x 24 t•m, using the criteria that the noise not exceed =0.5% in absorbance for our experiments (18). In this case, since the apertures defined an area much larger than the studied wavelength (about 3 pm), the lateral resolution was determined by the size of the apertures and not by the diffraction. The specimen was sampled at 6-micron increments until the 120-1am x 140-1am square area encompassing the hair cross section was mapped. This process took approximately 3.6 hours, comparable to the measurement time using the synchrotron source. RESULTS AND DISCUSSION CHEMICAL IMAGING OF THE UNTREATED HAIR Chemically, hair mainly consists of keratin, a protein highly crosslinked by the amino acid cystine. The infrared frequencies characteristic of the intramolecular vibrations of this protein in the mid-IR (4000-900 cm -1) are given in Table I and are similar to those seen in our measured spectra (Figure 2). The amide I and amide II bands have intensities up to 2 absorbance units, which is well within the acceptable range for the instruments. Figure 3 shows an optical image of a hair sample. It clearly shows three distinct regions, namely the medulla in the center, the cuticle on the outside, and the cortex in-between. Infrared images were made on this sample using both globar and synchrotron sources. In each case spectra were taken as series of sample positions as the sample was scanned in two directions. The integrated absorbances of the different typical bands of the hair (Table I) were then extracted and contour maps showing the absorbances of the different bands as a function of position in the sample were obtained. Images obtained from all
Purchased for the exclusive use of nofirst nolast (unknown)
From: SCC Media Library & Resource Center (library.scconline.org)