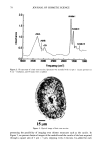
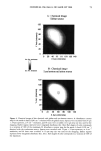
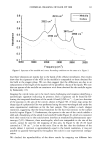
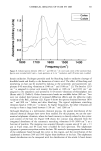
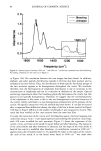
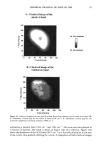
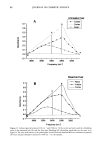
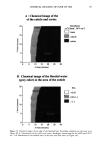
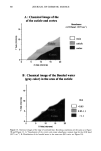
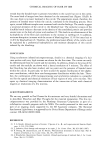
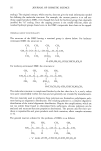
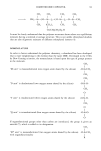
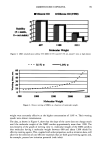
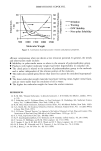
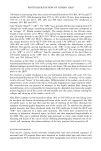
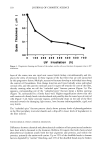
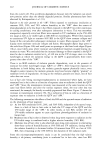
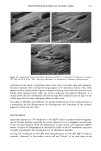
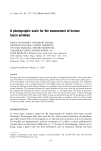
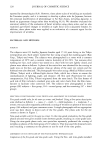
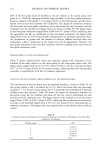
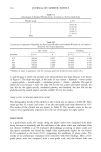
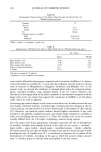
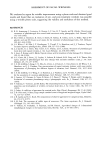
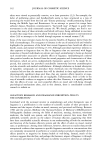
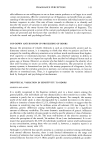
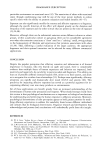
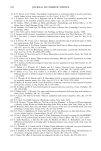
CHEMICAL IMAGING OF HAIR BY IMS 81 0.8 0.7 0.6 0.5 0.4 0.3 0.2 0.1 3050 " • Medulla 2918 cm : ....... Cortex 2962 cm-' ' i i • 2876 crn-' i 2860 cm - , i I I I ß 3000 2950 2900 2850 2800 Frequenc• (cm-') Figure 6. Spectrum of the medulla and cortex. Recording conditions are the same as in Figure 2. that these vibrations are mainly due to the lipids of the cellular membranes. Our results show that the signature of the vCH in the medulla is comparable to those obtained for the bulb in the anagen phase. We can then suggest that the differences are due to an enhancement of the length of the segment of the parraffinic chains of the lipids. We note that our spectra of the medulla are consistent with those obtained for the medulla region by Kalasinsky (15). Imaging the cuticle turns out to be much more challenging and requires identifying a spectroscopic signature indicating its presence. Such a signature can be found by fol- lowing the integrated absorbance of the amide A band (3290 cm -1, -3 pm) as a function of the position in the area of the cuticle, shown in Figure 5B. A linear map across the sharp edge of a polyamide film was performed using the same wavelength and under the same experimental conditions as for the hair sample. This yielded a much sharper transition, suggesting that the broad transition for the hair was intrinsic to the surface (cuticle) region (Figure 7). Furthermore, the spectra in the area of the cuticle exhibit a shift and a broadening of the amide I and amide II bands (Figure 8), which are consistent with their sensitivity to the cuticle/cortex interface as measured by photoacoustic spec- troscopy (5,21). However, these wavelengths, which are comparable to the size of the cuticle, cannot be used for the mapping of this area. In Figure 8, the vC=O band centered at 1730 cm -1 is due to the resin. Due to the fact that the thickness of the cuticle (about 4 microns) is approximately equal to the lateral resolution, it was not possible to quantify heterogeneity throughout the cuticle in our experimental configu- ration. We checked the reproducibility of the above results by mapping ten different hair

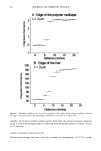
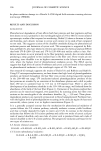
82 JOURNAL OF COSMETIC SCIENCE . c c 0- -1 180 160-' 140- o 120: -o 100-' - 40: a' Edge of the polymer n3JItilayer k=31•rn = -_ : • - -- 6 ,• 1'0 1'5 Distance (rricrons) B' Edge of the hair •.= 31.• •) 1'0 1'5 Distance (rricrons) Figure 7. Absorbance profiles of the 3-micron wavelength of the edges of the polymer multilayer (A) and the edge of the hair (cuticle) (B). Recording conditions are the same as in Figure 5B. samples, all of which exhibit similar results. Note that the lateral resolution obtained using 3-micron wavelength light is confirmed with the profile shown in Figure 7A and is -4 microns. CHEMICAL IMAaINa OF •LEACHED HAm Infrared spectroscopy has been used by a number of investigators (2,4,11) to study
Purchased for the exclusive use of nofirst nolast (unknown)
From: SCC Media Library & Resource Center (library.scconline.org)