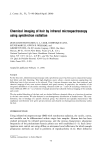
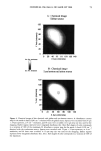
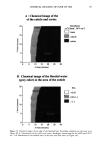
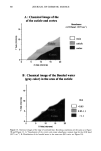
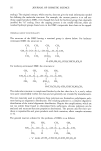
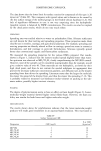
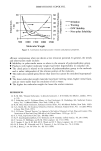
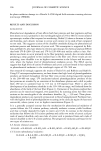
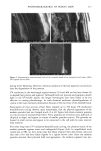
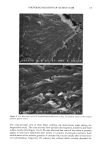
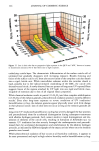
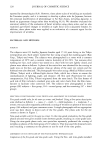
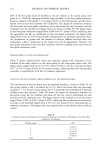
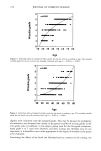
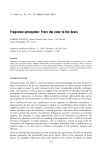
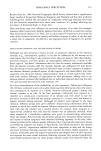
CHEMICAL IMAGING OF HAIR BY IMS 79 A ' Chemical Image Globar source 120 100 •: 8o P '• 6o •, 4o 20 Int. Abs. maximum . . Int. Abs. minimum I I 1 l 0 20 40 60 80 100 120 140 X Axis (microns) B ß Chemical image Synchrotron radiation source 120 lOO •' 80 '• 60 .• 40 20 0 0 20 4'0 6b 80 160 120 X Axis (microns) Figure 4. Chemical images of hair obtained with globar and synchrotron sources. A: Absorbance contour map for the amide A band (3290 cm -•) obtained with the globar source. Spectra were recorded with 24-Fro x 24-Fro apertures, at 4 cm-' resolution, and 64 scans were co-added. A 12-Frn step size was used for the mapping. Darker regions represent lower integrated absorbance (Int. Abs). Each degree of color corresponds to a variation of 10% of the maximum. B: Absorbance contour map for the amide A band (3290 cm-') obtained with the synchrotron source. Spectra were recorded with 12-Frn x 12-pm apertures, at 4 cm-' resolution, and 64 scans were co-added. A 12-Fro step size was used for the mapping. Darker regions represent lower integrated absorbance (Int. Abs.). Each degree of color corresponds to a variation of 10% of the maximum.

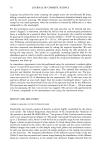
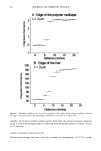
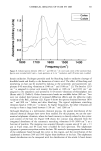
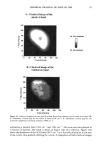
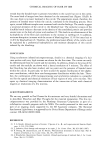
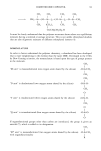
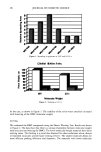
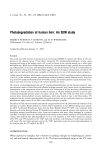
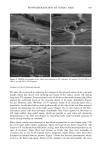
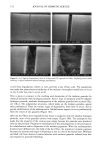
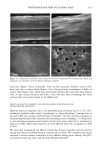
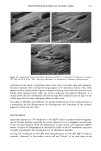
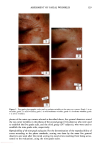
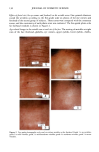
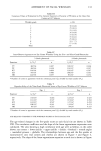
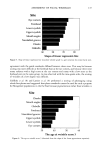
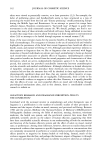
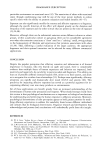
80 JOURNAL OF COSMETIC SCIENCE A' Optical Image 96. x Ax• (•m) X Axis (•n) hat. Abs. maximum : . .. hat. Abs. minimum B: Chemical Image of the cuticle C: Chemical image of the medulla Synchrotron radiation source Synchrotron radiation source Figure 5. Optical and chemical images of hair (synchrotron source). A: Optical image. B: Absorbance contour map of the area of the cuticle for the amide A band (3290 cm-•). Spectra were recorded with 3-pm x 3-pm apertures, at 4 cm -: resolution, and 128 scans were co-added. A 2-prn step size was used for the mapping. Darker regions represent lower integrated absorbance Ont. Abs.). Each degree of color corresponds to a variation of 10% of the maximum. C: Absorbance contour map of the area of the medulla for the amide A band (3290 cm-•). Recording conditions are the same as in Figure 5B. spectrum were 128 scans. The measurement time at each location was approximately one minute. The chemical image of the medulla (Figure 5C) represents the integrated absorbance of the aliphatic CH stretching vibrations centered at 2918 cm -• which are stronger in the medulla, as can be seen from the spectra in Figure 6. This vibration mode is due to asymmetric stretching CH 2 groups that are more intensive in the medulla with respect to the asymmetric stretching modes corresponding to the CH 3 motions centered at 2962 cm-•. The relative intensity of the symmetric modes of the same groups confirm this result. In a previous paper, regarding the infrared fingerprints of the hair fiber as a function of the position along its axis (from the bulb to the shaft), it was shown that the signature of the bulb in the anagen phase in the vCH region is different from that of the shaft (11). The differences observed were comparable to those observed here and suggest
Purchased for the exclusive use of nofirst nolast (unknown)
From: SCC Media Library & Resource Center (library.scconline.org)