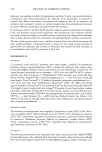
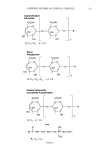
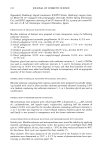
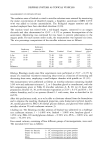
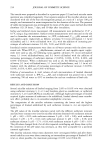
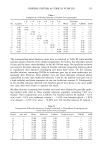
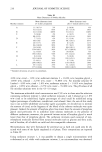
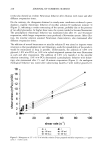
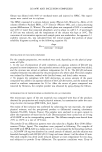
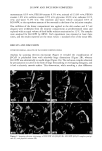
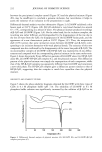
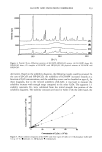
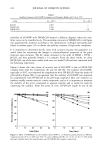
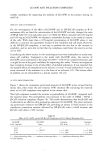
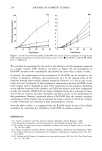
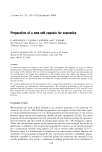
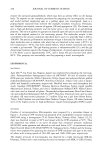
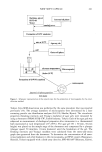
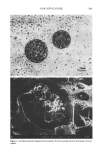
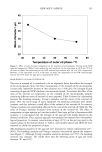
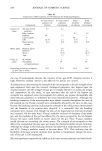
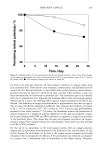
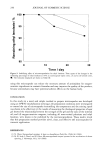
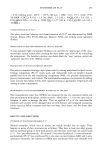
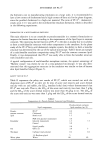
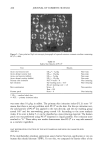
232 JOURNAL OF COSMETIC SCIENCE between the precipitated complex crystal (Figure 2C) and the physical mixture (Figure 2D), may be insufficient to conclude a genuine inclusion, but nevertheless it helps to assess the existence of an inclusion in the preparations in sight. Differential thermal analysis was also informative (Figure 3). LG106W exhibited a thin fusion peak at 192øC (Figure 3,B). [3-CyD exhibited a very broad thermal rise around 67 ñ 5 øC, corresponding to a release of water. The physical mixture produced recordings of [3-CyD and LG106W (Figure 3,A). On the other hand, for the inclusion complex, the recording was rather different, and distinguished by the disappearance of the rise due to the loss of water from the CyD, the disappearance of the LG106W fusion peak, and the appearance of a new characteristic peak at 202øC (Figure 3,C). Thus, the temperature shift (10øC) proves that some interaction exists between LG106W and [3-CyD, corre- sponding to an inclusion formation with weak physical bonds. The existence of this new compound was also confirmed by the disappearance of the water loss peak of [3-CyD. The microcrystalline complex of LG106W with HP-[B-CyD was examined by X-ray diffrac- tometry and compared with the corresponding physical mixture in the same molar ratio. Figure 4 shows the powder X-ray diffraction patterns of LG106W alone (A), HP-[B-CyD alone (B), LG106W-HP-[B-CyD complex (C), and the physical mixture. The diffraction pattern of the physical mixture was simply the superposition of each component, while that of the HP-[B-CyD complex was apparently different from LG106W and constitutes a new solid phase. The HP-[B-CyD complex gave a diffraction pattern similar to that of HP-[B-CyD, suggesting that the complex is much less crystalline than the physical mixture. SOLUBILITY AND STABILITY STUDIES Figure 5 shows the phase solubility diagrams obtained for LG106W with three types of CyDs in 0.1 M phosphate buffer (pH 7.0). The solubility of LG106W in 0.1 M phosphate buffer solution was significantly increased by the addition of [3-CyD or its •••••'•••(A) ---' (c) o io Temperature (•) Figure 3. Differential thermal analysis of physical mixture (A), LG106W (B), and LG106W-[3-CyD complex precipitate (C).

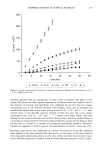
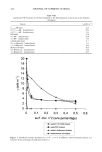
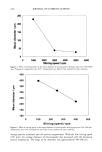
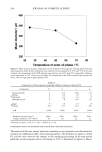
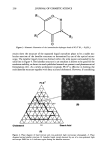
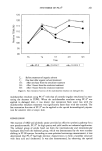
LG 106W AND INCLUSION COMPLEXES 233 I i i 20000 - •, 15000 • 10ooo • • ---'} •--•• ..... {A) 5000 (B) (c) (,) I I , 10.0 20.0 30.0 20( ø ) Figure 4. Powder X-ray diffraction patterns of LG106W-HP-[•-CyD system. (A) LG106W alone (B) HP-[•-CyD alone (C) complex of LG106W with HP-[•-CyD (D) physical mixture of LG106W and HP-[3-CyD. derivatives. Based on the solubility diagrams, the following results could be attained: In the case of •-CyD and HP-•-CyD, the solubility of LG106W increased linearly as a function of CyD concentrations, and the solubility curves can be classified as type AL. In these diagrams, due to the limited solubility of •-CyD, it was hard to measure the solubility increase with enough range compared to the other CyDs. The apparent 1:1 stability constants, Kc, were calculated from the initial straight line portion of the solubility diagrams. The stability constants are listed in Table I. On the other hand, the 25. 20. 1õ. 10. Concentration of CyDs ( x 10-3M) Figure 5. Phase solubility diagrams of LG106XV with three types of CyDs in 0.1 M phosphate buffer (pH 7.0) at 25 øC. O, [3-CyD O, HP-[3-CyD •r, DM-[3-CyD.
Purchased for the exclusive use of nofirst nolast (unknown)
From: SCC Media Library & Resource Center (library.scconline.org)