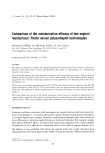
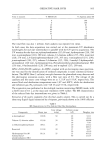
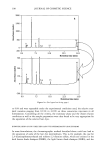
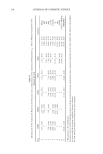
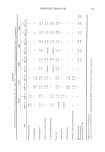
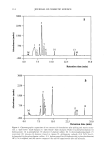
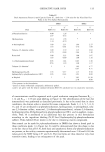
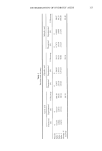
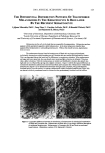
OXIDATIVE HAIR DYES 115 Table IV Peak Asymmetry Factor (s) and Capacity Factor (k', dead time = 2.50 min) for the Nine Hair Dye Peaks in the Two Spiked Formulations DBRS DBLS s k' s k' Peak RSD (%) RSD (%) RSD (%) RSD (%) p-Phenylenediamine 0.88 1.26 * * 2.07 0.43 Hydroquinone 1.14 1.78 * * 1.44 O.79 m-Aminophenol 1.09 2.31 1.04 2.27 1.63 0.81 4.76 1.08 Toluene-2,5-diamine sulfate 1.09 2.79 1.15 2.82 3.70 0.60 2.64 1.40 Resorcinol 1.08 3.23 1.08 3.07 1.65 0.80 1.68 1.16 2,4-Diami nophe noxye thanol 0.85 3.63 0.85 3.30 0.53 1.10 1.48 1.17 Toluene-2,4-diamine • * * 1.02 4.77 0.97 0.71 Hydroxypropyl-bis-(N- 1.35 9.57 1.15 9.50 hydroxyethyl-p-phenylenediamine) HC1 4.93 0.44 3.93 0.89 o•-Naphtol * * 1.05 11.38 2.78 0.08 * Not present in the formulation. a Listed in Annex II (banned compound), deliberately spiked. s and k' are given with the relative standard deviation RSD (%) calculated on ten consecutive injections. of concentrations could be separated with a good resolution comprised between R6, 7 -- 1.14 and R5, 6 = 1.55 (see peak labeling in Figure 4). The identification of the hair dye intermediates was performed as described previously. It has to be noted that in these conditions, the elution order is inverted for some compounds. Peaks 1, 2, 4, 5, 7, 6, 9, 13, and 14 are attributed to p-phenylenediamine, hydroquinone, m-aminophenol, tolu- ene-2,5-diamine sulfate, resorcinol, 2,4-diaminophenoxyethanol, toluene-2,4-diamine, hydroxypropyl-bis-(N-hydroxyethyl-p-phenylenediamine) HC1, and tx-naphtol, respec- tively. Peak 10 is attributed to an additional hair dye present in this formulation according to the ingredient labeling (N,N'-bis-(2-hydroxyethyl)-p-phenylenediamine sulfate). Peaks labeled M are shown to be due to remaining matrix compounds. One remark can be made for p-phenylenediamine in DBRS that shows a broad peak in these conditions (peak 1 in Figure 4a). It could be demonstrated that this shape is due to the fact that at this pH (5.9), both basic and amphoteric forms ofp-phenylenediamine are present, as the acidity constants experimentally determined were 2.46 and 6.04 (the values given by NIST being 2.97 and 6.3). The two forms are thus eluted at very close retention times, leading to an enlargement of the peak.

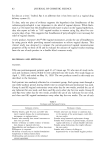
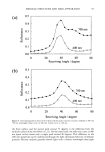
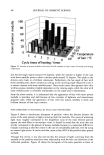
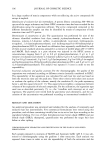
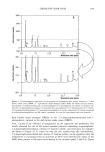
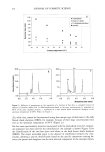
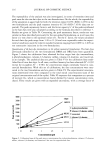
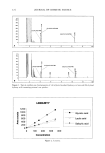
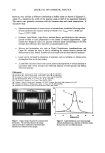
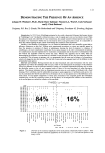
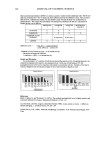
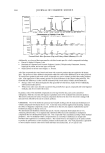
116 JOURNAL OF COSMETIC SCIENCE The repeatability of the analysis was also investigated, in terms of retention times and peak areas for the nine hair dyes in the two formulations. On the whole, the repeatability of the separation is again high for both the retention times (0.29% RSD 1.65 %) in the two formulations and the peak response intensity (0.72%RSD7.45%) (data not re- ported). The peak asymmetry factor s and the factor capacity k' of the peaks attributed to the hair dyes were also calculated according to the formulas described in reference 7. Results are given in Table IV. Concerning the peak asymmetry factor, results are very similar to those described previously for the non-spiked formulations, as in all cases this factor s is very close to the optimum value of 1. For the k' factor, the values calculated for each hair dye peak range from 1.26 to 11.38 and were repeatable under the experi- mental conditions used, the relative standard variation ranging from 0.08% to 1.40% on ten consecutive injections in the two formulations. Quantitation of the hair dye intermediates in the spiked commercial formulations. The hair dyes previously identified in the two formulations DBRS and DBLS have been quantified. Figure 5 shows the calibration lines obtained for four target hair dye intermediates, p-phenylenediamine, toluene-2,5-diamine sulfate, toluene-2,4-diamine, and resorcinol, as an example. The analytical data are given in Table V for the calibration lines estab- lished for all nine hair dyes. In all cases, excellent linearity has been obtained (R20.992 except for o•-naphtol, R 2 = 0.981) for concentration ranges commonly found in com- mercial formulations. With this set of calibrations, the dye concentrations were mea- sured in the two formulations and are given in Table VI. The experimental concentra- tions determined were then compared to the total initial concentrations (sum of the original concentration and of the spike). Table VI expresses this comparison as a percent of recovery Re, which is concentration found divided by known concentration intro- duced. These results are given with an expanded uncertainty, with a coverage factor of 3500 ,_, 3000 2500 • 2000 g 15oo 1000 500 s lope 1668.30 _ * p-phenylenediamine ß toluene-2,5-diamine sulfate 882.83 [] resorcinol 669.31 o toluene-2,4-diamine 347.52 0 0.5 1 1.5 2 2.5 Concentration (g/l) Figure 5. Calibration lines of the peak area vs concentration for p-phenylenediamine, toluene-2,5-diamine sulfate, toluene-2,4-diamine, and resorcinol. See text for experimental data.
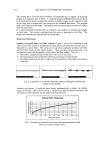
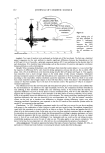
Purchased for the exclusive use of nofirst nolast (unknown)
From: SCC Media Library & Resource Center (library.scconline.org)