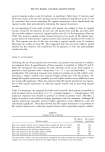
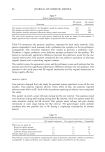
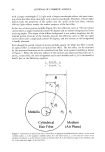
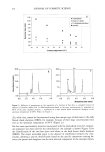
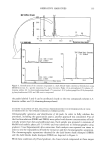
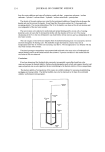
2001 ANNUAL SCIENTIFIC MEETING 143 ELASTASE INHIBITION ASSAY AS A TOOL FOR FORMULATION OPTIMIZATION AND QUALITY CONTROL Howard Epstein •, Hank Overkamp', Shigeru Moriwaki', Naoko Tsuji 2, Raymond E. Boissy, Ph. D2 and Yang Zhao' •The Andrew Jergens Company, CincinnatL OH, 2Kao Corporation, Tochigi, Japan and 3University of Cincinnati College of Medicine, Cincinnati, OH Introduction Formulating products with natural matertals such as botanicals often poses a variety of unique challenges. For example, many different plants may have similar names, different parts of plants may have different chenfical constituents. Important constituents of the desired botanical may be lost if the plant is not harvested and processed in an appropriate manner and when extracted, resulting chemical constituents may vary. Furthermore, the method of extraction is important, and when purchasing botanicals from unknown sources there is a risk of adulteration of the material during processing. In cases where chenfical assays may not be practical, a biological assay can be an alternative approach with respect to quality control and fornlulatlon optimization. A biological assay can also serve as a rapid screening tool to evaluate several new botanicals or evaluate the effect of process variables on kayown botanicals. Fibroblast ceils found in the dermal layer of skin and produce elastase, an enzyme kayown to break down the connective protein elastin. Fibroblast cells may be obtained from tissue samples and cultured in flasks relatively easily compared to other cell types. For this reason fibroblast cell cultures are a popular option for dermatological research. In this study, botanical extracts with the ability to inhibit elastase activity were investigated using a fibroblast elastase mlnbinon assay. Materials and Methods Dem•al fibroblasts obtained from neonatal foreskin were cultured to 100% confluence in T-75 culture flasks. Harvested fibroblast cells were washed with cold PBS buffer followed by centrifugation at 1,200 RPM for 10 nfinutes. Cells were solubilized in elastase buffer, 0.1% Triton-X 100, 0.2 M Tris- HC1 (pH 8.0) buffer, followed by ultrasonication and then centrifugation at 3,000 RPM for 20 nfinutes to obtain supernatants as the source of fibroblast derived elastase. Protein Assay A protein standard curve is developed to detem6ne the amount of protein in the fibroblast supernatant. A Pierce Protein Assay Kit was used to prepare serial dilutions of the protein standard from 1000 ug/ml to 1.953 ug/ml dispensed in a 96 well Falcon assay plate. F•brobla•.t lysate diluted to 1/2 concentration with elastase buftkr was added to three of the ten wells used, and a 1/10 dilution was added to another three wells. The 96 x•ell plate was incubated at 37 ø C for 30 minutes and concentration was measured spectrophotometrically at 560 nm. The curve generated, O.D. vs. protein concentration is used to determine optimal adjustment of protein concentration of fibroblast lysate to be used in the assay. Elastase Enzyme Standard Curve Elastase actMty is expressed as" 1 unit, representing the activity for release of 1 mnol ofp- nitroaniline per hour." 62.5 n•V[ ofp-nitroamline (pNA) is used to generate a standard curve. Serial diluttons ofp-nitroamline in DMSO from 250 nM./1 to 31.25 nM./l are placed in a Falcon 96 well assay plate. This plate is read spectrophotometrically at 405 ran. The corrected absorbance values for the standards were used to calculate the standard line equation using linear regression. General equation: absorbance at 405 nm = constant 1 (p-nitroamhne concentration) + constant 2. Elastase Activity 200 ul of fibroblast lysate is added to all 12 wells in a horizontal row of a 96 well assay plate. Then, various dilutions (i.e., IX, I/2X, 1/4X, and 1/10X) of test botanical extract were added to three triplicate wells respectively. To a second companion horizontal row, elastase buffer without cell lysate was added then combined w•th the same dilutions of botanical extract. This companion row was used to subtract the natural color of the botanical extract from the spectrophotometric reading. Phosphoramidon (1 uM at a

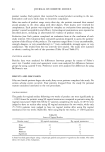
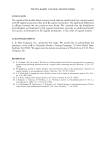
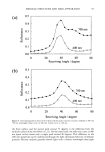
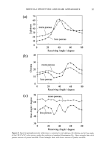
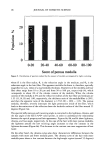
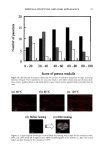
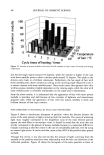
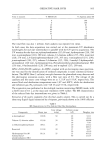
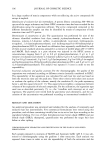
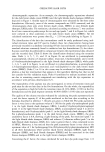
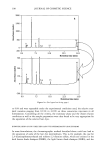
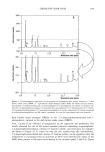
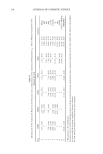
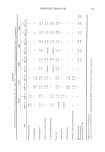
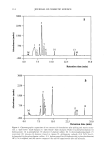
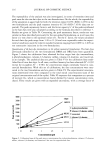
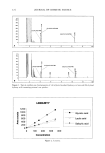
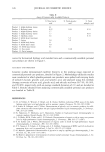
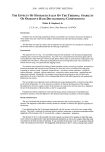
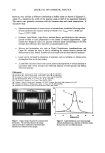
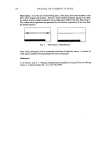
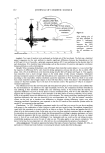
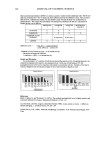
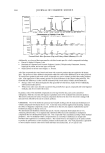
144 JOURNAL OF COSMETIC SCIENCE final concentration) solution in DMSO was used as a positive control in three additional wells. The 96 well plate was incubated at 37 ø for 15 minutes to allow sufficient time for the inhibitor to react. Four ul of 62.5 mM STANA, a substrate for elastase was then added to each well and the plate was incubated for an additional hour. The release ofp-nitroaniline was measured by absorbance at 405 nm. Calculation of elastase activity was as follows: REFERENCE INHIBITOR INHIBITOR BUFFER/SUB- I 2 3 STRATE 4 ELASTASE X X X SUBSTRATE X X X X INHIBITOR (PLANT EXTRACT) X (high conc.) X (low conc.) BUFFER X X X X [Inhibition ] (%) = [conc. ](1) - [conc.] (2) or (3) [conc. pNA] (1) - [ conc.] (4) Inhibited Activity/Normal Activity = % of normal activity. Calculation of amount of inhibition: % inhibition = 100% - % of normal activity. Results and Discussion For test botanical "A", selection of both the solvent and the quantity (w/w) of botanical material to be extracted is important with respect to anti-elastase activity. In the case of test botanical "B", the geographical source of the root is important with respect to anti-elastase activity. Extraction time may be reduced, if higher levels of botanical or higher levels of solvent such as ethanol are used. INHIBITION -1•30TANICAL A • • I • / I • I I a•i References Bicth, J., Spicss, B., and Wcrmuth, C.G. (1974). The synthesis and analytical use of a highly sensitive and convenient substrate for clastasc. Biochemical Medicine 11:350 - 357. Lee, Kun Kook, and Choi, Jung Do, (September/October 1998). Areca catechu L. extract. I. Effects on elastase and aging. J. Cosmetic Science, 49:285 - 297. Lodish, Harvey, et.al., (1995). Molecular Cell Biology. 3ed Edition. W.H. Freeman and Company, New York.
Purchased for the exclusive use of nofirst nolast (unknown)
From: SCC Media Library & Resource Center (library.scconline.org)