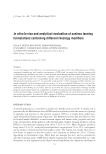
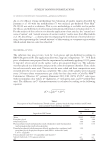
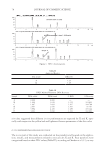
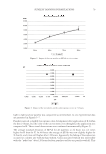
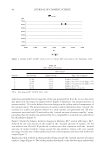
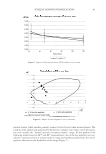
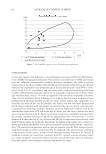
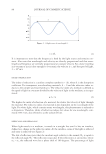
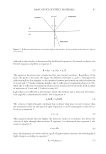
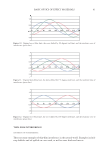
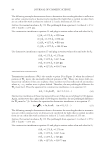
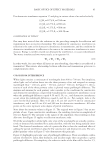
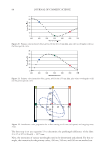
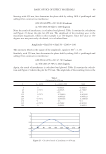
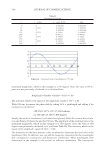
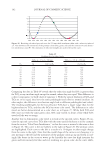
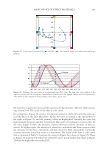
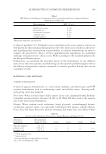
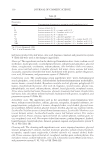
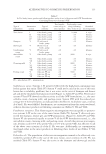
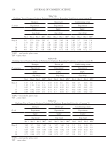
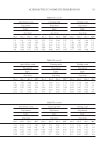
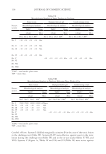
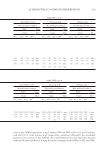
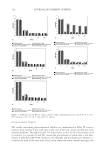
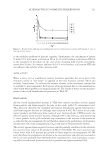
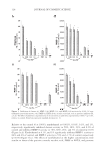
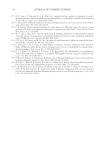
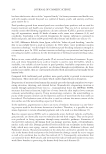
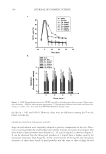
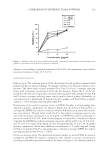
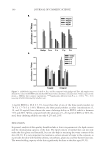
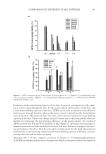
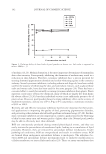
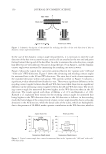
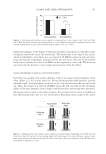
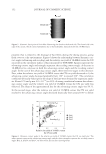
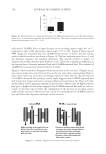
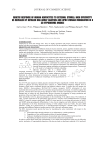
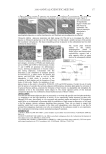
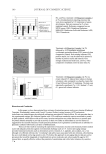
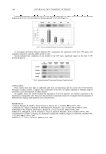
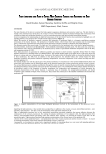
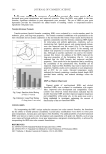
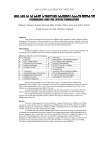
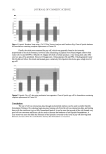
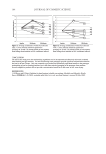
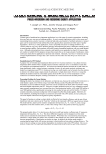
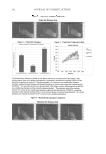
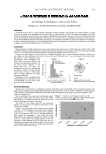
JOURNAL OF COSMETIC SCIENCE 96 the incident angle will be held at normal, and only the fi lm thickness will vary. This simplifi cation is in fact the reality of effect material production. The refractive index is dictated by the material of choice and samples are always measured at a fi xed angle. As a fi lm is grown, only the thickness changes. Figure 16 highlights fi lm thicknesses of 60, 80, 100, 120, and 155 nm. If the relative intensities of the primary colors for each are plotted, one can see how the resulting color caused by interference is obtained. The primary color intensities for the 60-nm fi lm are plotted in Figure 17. High intensities of red, green, and blue add to white interference, also referred to as pearl. The intensities of other wavelengths are added to fi ll out the spectral curve. The primary color intensities for the 80-nm fi lm are plotted in Figure 18. High intensities of red, green, and low-intensity blue add to yellow interfer- ence, also referred to as gold. The intensities of other wavelengths are added to fi ll out the spectral curve. The primary color intensities for the 100-nm fi lm are plotted in Figure 19. A high intensity of red and low intensities of green and blue add to red interference. The intensities of other wavelengths are added to fi ll out the spectral curve. There is a blue component observed of less than 450 nm that makes this color technically magenta. The primary color intensities for the 120-nm fi lm are plotted in Figure 20. A high intensity of blue and low intensities of red and green add to blue interference. The intensities of other wavelengths are added to fi ll out the spectral curve. The primary color intensities for the 155-nm fi lm are plotted in Figure 21. A high intensity of green and low intensi- ties of red and blue add to green interference. The intensities of other wavelengths are added to fi ll out the spectral curve. Figure 15. Intensity of the three primary colors versus pathlength difference. Figure 16. Highlighted pathlengths for selected fi lm physical thicknesses. The thickness of each fi lm is in- dicated on top of the highlighted line.

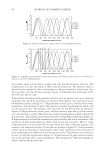
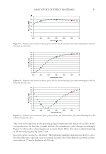
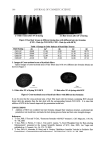
BASIC OPTICS OF EFFECT MATERIALS 97 The color series depicted in the preceding fi gures represents the nature of an effect mate- rial production. As the fi lm is made thicker, the interference color changes accordingly. Figure 22 shows this color progression in more detail. Here, the color is plotted starting at 60 nm and progressing every 5 nm. Spectral curves can also be calculated. The following example demonstrates how to calcu- late the refl ectance spectral curve at normal incidence for a thin fi lm (in air) with a refrac- tive index of 2.5 and a thickness of 255 nm. Figure 17. Primary color intensities (blue, green, red) for the 60-nm fi lm, plus other wavelengths to fi ll out the pearl spectral curve. Figure 18. Primary color intensities (blue, green, red) for the 80-nm fi lm, plus other wavelengths to fi ll out the gold spectral curve. Figure 19. Primary color intensities (blue, green, red) for the 100-nm fi lm, plus other wavelengths to fi ll out the red spectral curve.
Purchased for the exclusive use of nofirst nolast (unknown)
From: SCC Media Library & Resource Center (library.scconline.org)