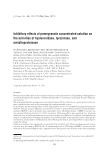
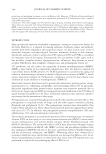
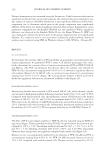
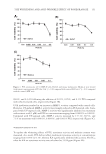
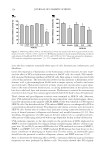
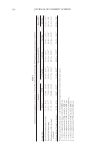
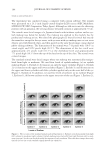
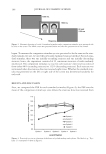
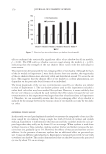
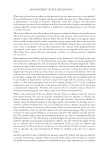
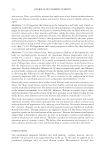
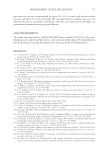
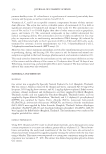
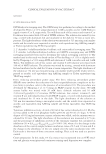
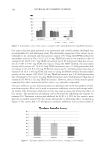
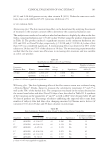
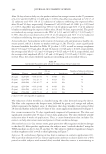
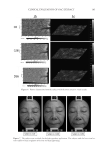
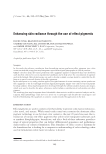
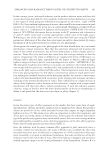
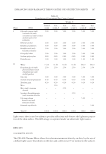
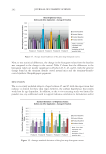
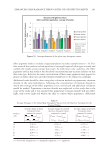
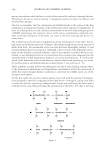
JOURNAL OF COSMETIC SCIENCE 202 Now, to test statistical differences, the change in the histogram values from the baseline was compared to the change in the control. Table V shows that the differences in the histogram values are mostly signifi cant in Products B, C, D, and E, with the greatest change found in the titanium dioxide coated natural mica and the titanium-dioxide- coated synthetic fl uorphlogopite pigments. DISCUSSION The in vivo study included subjects of ages between 45 and 65 with the expectation that radiance is desired for these skin types however, the authors hypothesize that results would not be age dependent. In addition, as the in vivo screening study was limited by panelist size, any additional work to support radiance correlation to formulation and/or Figure 14. Average mean brightness of the gloss map histogram curves. Figure 15. Average standard deviation of the gloss map histogram curves.

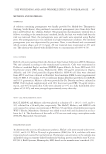
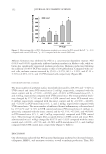
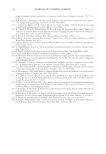
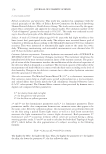
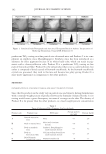
ENHANCING SKIN RADIANCE THROUGH THE USE OF EFFECT PIGMENTS 203 effect pigment needs to include a larger population to reduce sample error (n 6). Fur- ther research also needs to include panelists of varying Fitzpatrick skin types to study and confi rm the results across various skin tones. As with most color cosmetics, the effect pigments used in this study at the described concentrations may increase radiance on this skin tone type however, the same concentration of these same pigments may appear too glossy on darker skin tones and the formulas would have to be adjusted accordingly. Additional work should be done using this evaluation method on pigmentary titanium dioxide in the same formulation. Adjusting the concentration of titanium dioxide to match the coverage of the effect pigments is not a trivial task and additional validation would be needed. Pigmentary titanium dioxide was neglected in this study due to the scope of the study and it was assumed that pigmentary titanium dioxide will not refl ect light, only scatter light and whiten the skin to a matte white appearance. Additional Figure 16. Average skewness of the gloss map histogram curves. Table V Average Changes in the Gloss Map Histogram Values from the Baseline Compared to the Control Values Product code Average change in mean histogram values compared to control 10min baseline product 10min baseline control – – x x x x ¯ ¡ ° ¡ ° ¡ ° ¡ ° Average change in standard deviation histogram values compared to control 10min product 10min baseline control – – T Tbaseline T T ¯ ¡ ° ¡ ° ¡ ° ¡ ° Average change in skewness histogram values compared to control 10min baseline product 10min baseline control – – ¯ ¡ ° ¡ ° ¡ ° ¡ ° γ γ γ γ A 0.42 (−) −0.36 (−) −0.25 (−) B 6.00 (++) 2.76 (++) −1.33 (++) C 6.29 (++) 3.52 (++) −1.39 (++) D 2.96 (++) 2.52 (++) −0.70 (++) E 2.11 (++) 0.78 (−) −0.65 (++) (−): Statistically insignifi cant, (+): marginally signifi cant, (++): signifi cant.
Purchased for the exclusive use of nofirst nolast (unknown)
From: SCC Media Library & Resource Center (library.scconline.org)