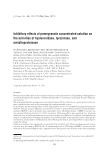
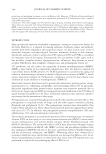
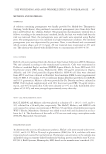
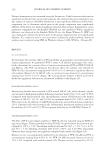
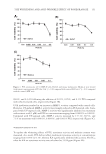
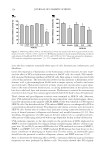
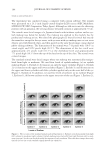
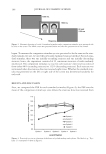
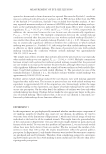
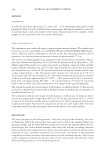
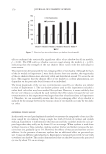
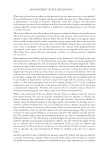
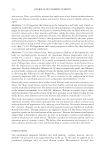
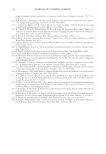
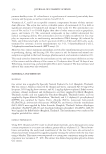
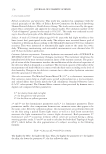
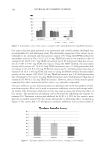
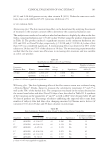
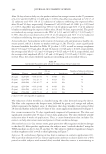
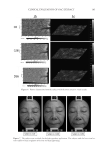
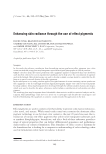
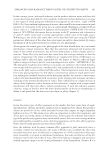
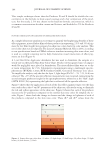
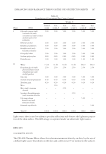
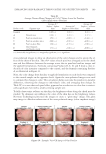
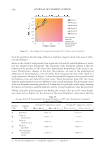
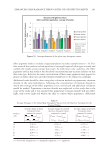
JOURNAL OF COSMETIC SCIENCE 200 from the parallel polarized image (refl ection emphasis image) to show only areas of refl ec- tion and radiance. Areas on the cheek of each panelist were again selected and the pixel brightness or inten- sity was tabulated into histograms. The advantage of the histogram analysis is that the behavior of the product on the entire three dimensional morphology of the cheek is cap- tured. Characteristic changes to the skin, like radiance, are seen in the mathematical defi nitions of the histogram curves (5) rather than averaging the area of the cheek to a single parameter. Images in Figure 13 show the example histograms of one panelist with the baseline curve seen behind the fi nal curve. These histograms show that the curves with the applied products are very different to the control histogram. The histogram curves of the test formulas containing products A–E show less of a peak and a wider range, meaning the skin is not having a uniform lightness and the average brightness value has increased. Taking each gloss map histogram and fi nding the average value gives the mean bright- ness value seen in Figure 14. An increase in the mean brightness value means that the Figure 11. Visia images color change from averaged a*b* values across six panelists. Table IV Average Visia CR Cross-Polarized Images Changes in a*b* from the Baseline Compared to the Control Values Product Code Pigment Type Average da* compared to control ¯ ¡ ° * * * * 10min baseline 10min baseline product control – – a a a a Average db* compared to control ¯ ¡ ° * * * * 10min baseline 10min baseline product control – – b b b b A Raw mica −0.01 (−) −0.12 (−) B Pearl on natural mica −1.53 (++) −1.5 (−) C Pearl on synthetic mica −0.46 (−) −1.71 (++) D Pearl on glass fl ake −0.94 (++) −0.85 (−) E Dried bismuth oxychloride crystal −1.40 (++) −0.64 (++) (−): Statistically insignifi cant, (+): marginally signifi cant, (++): signifi cant.

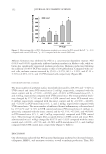
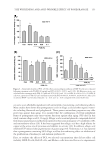
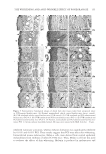
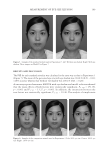
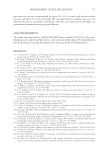
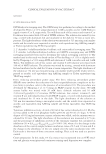
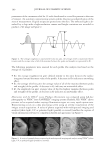
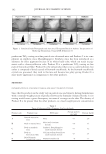
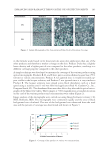
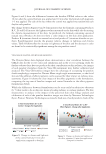
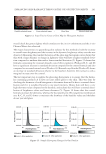
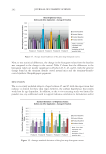
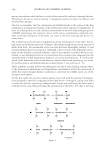
ENHANCING SKIN RADIANCE THROUGH THE USE OF EFFECT PIGMENTS 201 overall cheek has gotten lighter which correlates to the in vitro colorimetry and the in vivo Chroma Meter data observed. The major characteristic to quantifying skin radiance by this method is both the increase in overall mean brightness and the increase in the dynamic brightness values over the area observed. Measuring the standard deviation of the gloss map histogram curves shows that skin with a large dynamic or change in lightness value will have a higher standard devia- tion compared to uniform skin with a lower standard deviation (5). Figure 15 shows that formulas containing the titanium dioxide coated effect pigments (Products B, C, and D) have a signifi cant increase in standard deviation compared to the control formula and also compared to uncoated natural mica (Product A). Bismuth oxychloride (Product E) shows an increase in standard deviation relative to the baseline however, the increase is only a marginal increase over the control. The last important step to analyze the gloss map histograms is to ensure that the formu- las containing products A–E have not just added gloss to the skin. This was done by checking the skewness of each histogram to determine how well it fi ts to a normal distri- bution and if it is weighted heavily to one pixel intensity. Glossy skin will have a very high skewness value compared to the baseline, and radiant skin will have a normal distri- bution of brightness values and lower skewness (5). Figure 16 shows that the control formula increases the skewness, whereas the four pearlescent effect pigments tested (prod- ucts B, C, D, and E) lower or maintain the skewness of the baseline values and therefore do not just add gloss. Figure 12. Steps Used to Create a Gloss Map for Histogram Analysis Figure 13. Sample Histogram Changes for One Panelist
Purchased for the exclusive use of nofirst nolast (unknown)
From: SCC Media Library & Resource Center (library.scconline.org)