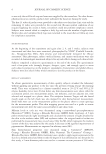
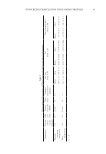
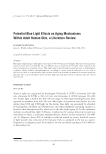
10 JOURNAL OF COSMETIC SCIENCE Figure 3. (Continued)

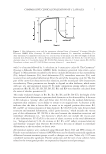
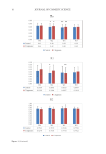
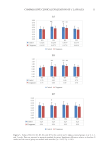
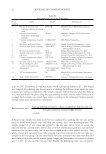
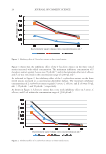
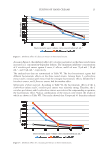
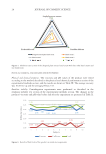
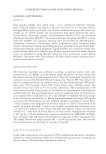
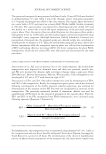
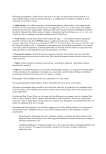
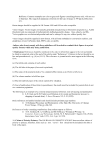
11 COMPARATIVE CLINICAL EVALUATION OF C LAPPACEA Figure 3. Values of R0, R1, R2, R5, R6, and R7 for the control and C lappacea-treated groups in at 0, 2, 4, and 5 weeks. Data are reported as means ± standard deviation. Significant differences relative to baseline (0 weeks) and the control group are marked with asterisks (*p 0.05, **p 0.01).
Purchased for the exclusive use of nofirst nolast (unknown)
From: SCC Media Library & Resource Center (library.scconline.org)