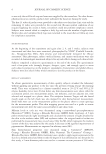
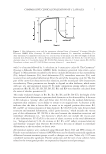
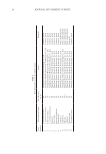
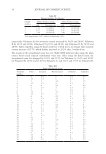
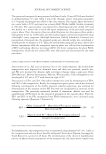
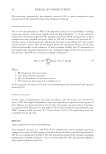
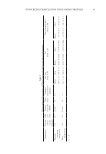
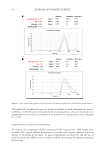
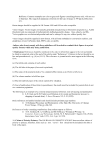
40 JOURNAL OF COSMETIC SCIENCE PFs-containing nanoparticles, free ethanolic extract of PFs, or plain nanoparticles were incorporated in the prepared cream using levigation technique. DETERMINATION OF SPF The in vitro determination of SPF of the prepared sunscreens was performed according to previous reports, with minor modifications (4). Experimentally, 1 g of the sunscreen formulation containing either free PFs, propolis-containing PLGA nanoparticles, or plain nanoparticles were weighed and were added to 100 mL of ethanol and sonicated for 5 minutes using an ultrasound bath followed by filtration using Whatman® filter papers (Tisch Scientific, Cleves. OH, United States). Next, the transparent filtrate (10 mL) was collected and reached to the volume of 50 mL by ethanol. Finally, the UV absorbances of the samples were measured separately in the wavelength range of 290–320 nm in each 5 nm intervals. The SPF was calculated according to Equation 3. SPF CF I( Abs( = ( ) ) ∑EE * * * 290 320 λ λ) λ (3) Where: • EE: Erythemal effect spectrum. • I (λ): Solar intensity spectrum. • Abs (λ): Absorbance of sunscreen extract. • CF: Correction factor that was considered as 10. In this equation, the values of EE and I in each wavelength were determined and reported previously (15). STATISTICAL ANALYSIS In this study, all experiments were done in triplicate and the results were reported by mean ± SD. Two sample independent t-tests were applied for comparison of two groups of data, whereas, for statistical analysis of more than two groups, one-way analysis of variance accompanied with Tukey post hoc was applied. The statistical analysis was performed using SPSS® software (IBM, Armonk, NY, United States, V.16.0). The significancy level was considered 0.05 in all cases. RESULTS CHARACTERIZATION OF PLGA NANOPARTICLES Zeta potential, particle size, and PdI of the nanoparticles (either propolis-containing nanoparticles or plain PLGA nanoparticles) were determined before and after lyophilization. The data are summarized in Table I. The size distribution graph of the propolis-containing nanoparticles is shown on Figure 1. As it is obvious from the table, the particles exhibited proper physicochemical properties.

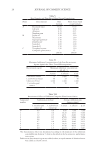
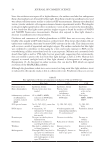
Table I Physicochemical Characteristics of PLGA Nanoparticles Before and After Lyophilization Formulation Polymer concen- tration (mg/mL) PVA 2% (mL) Homog- enizer rate (RPM) Time (min) Galangin concentration (mg/mL) Size (nm) mean ± SD PdI mean ± SD Zeta potential (mV) mean ± SD Propolis- containing nanoparticle 33.3 10 15,000 15 5.3 Before After Before After Before After 263 ± 13 381 ± 11 0.381 ± 0.025 0.379 ± 0.021 -15.4±0.2 -9.8 ± 0.11 Plain nanoparticles 33.3 10 15,000 15 ----- 211 ± 24 289 ± 17 0.247 ± 0.005 0.412 ± 0.006 -13.8±0.3 -10.2±0.5 (=3) 41 SUNSCREEN FORMULATION CONTAINING PROPOLIS
Purchased for the exclusive use of nofirst nolast (unknown)
From: SCC Media Library & Resource Center (library.scconline.org)