160 JOURNAL OF COSMETIC SCIENCE
FLOW CYTOMETRIC ANALYSIS
PIG1 and MelanA cells (1 × 10⁶) were trypsinized and washed in ice-cold phosphate
buffered saline (PBS). Cells were then fixed with 70% ethanol for 12 hours at 4°C. After
washing, cells were resuspended and incubated at 37°C for 30 minutes in 0.5 ml of PBS
containing 10 mg/ml propidium iodine (Sigma) and 5 mg/ml RNase A (Sigma). Proportions
of cells in either G1 or S phase of cell cycle were analyzed by flow cytometry using a BD
FACSCalibur™ (Becton-Dickinson, New Jersey, USA).
IMMUNOFLUORESCENCE ANALYSIS
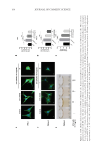
PIG1 and MelanA cells were fixed with 4% paraformaldehyde for 10 minutes, washed
with PBS 2 times, and permeabilized with 0.1% Triton X-100 for 10 minutes. After
blocking with 0.2% BSA for 30 minutes, cells were incubated with the prepared FITC-
labeled phalloidin working solution or antibody of anti-β-Catenin at room temperature,
for 30 minutes in the dark. Fluorescent images were obtained by an Olympus fluorescence
microscope (Olympus Corporation, Tokyo, Japan) and the number of melanocyte dendrites
was counted.
RNA ISOLATION AND REAL-TIME QUANTITATIVE PCR (RT-QPCR)
Cell RNAs were isolated using the Invitrogen TRIzol® reagent (Thermo Fisher Scientific,
Massachusetts, USA). cDNAs were synthesized by using the M-MLV reverse transcriptase
kit (Promega Corporation, Wisconsin, USA) and used as the templates for quantitative
polymerase chain reaction (qPCR) (MxPro QPCR Software, Agilent Technologies, USA)
according to manufactural instructions. The primers were as followed: homo glyceraldehyde
3-phosphate dehydrogenase (GAPDH): forward, 5’-ACCCAGAAGACTGTGGATGG-3’,
reverse, 5’-TTCAGCTCAGGGATGACCTT-3’ homo Rac1: forward, 5’-
GAGACGGAGCTGTTGGTAAAA-3’, reverse, 5’- ATAGGCCCAGATTCACTGGTT-3’
homo Rab27a: forward, 5’-ACAACAGTGGGCATTGATTTCA-3’, reverse,
5’-AAGCTACGAAACCTCTCCTGC-3’ mus GAPDH: forward, 5’-ACCCAGAAGAC
TGTGGATGG-3’, reverse, 5’-TTCAGCTCAGGGATGACCTT-3’ mus Rac1: forward,
5’-TCCGCAAACAGATGTGTTCTTA-3’, Reverse, 5’-CGCACCTCAGGATACCACT
TT-3’ mus Rab27a: forward, 5’-TCGGATGGAGATTACGATTACCT-3’, reverse,
5’-TTTTCCCTGAAATCAATGCCCA-3’. qRT-PCR was performed to detect the
expression of related genes according to the following conditions: 95°C for 15 seconds,
55°C for 30 seconds, and 72°C for 30 seconds (40 cycles).
WESTERN BLOT ANALYSIS
Cells were seeded into a 6-well plate at a density of 2 × 10⁵/ml. 20 nM ET-1 was added
to treat cells for 24 hours. Subsequently, cells were treated with different concentrations of
HCP. After 24 hours, radio–immunoprecipitation was used for total protein extraction. The
extracted proteins were then separated by 10% SDS-polyacrylamide gel and transferred to
nitrocellulose filter membranes. After blocking with 5% BSA for 1 hour, membranes were
FLOW CYTOMETRIC ANALYSIS
PIG1 and MelanA cells (1 × 10⁶) were trypsinized and washed in ice-cold phosphate
buffered saline (PBS). Cells were then fixed with 70% ethanol for 12 hours at 4°C. After
washing, cells were resuspended and incubated at 37°C for 30 minutes in 0.5 ml of PBS
containing 10 mg/ml propidium iodine (Sigma) and 5 mg/ml RNase A (Sigma). Proportions
of cells in either G1 or S phase of cell cycle were analyzed by flow cytometry using a BD
FACSCalibur™ (Becton-Dickinson, New Jersey, USA).
IMMUNOFLUORESCENCE ANALYSIS
PIG1 and MelanA cells were fixed with 4% paraformaldehyde for 10 minutes, washed
with PBS 2 times, and permeabilized with 0.1% Triton X-100 for 10 minutes. After
blocking with 0.2% BSA for 30 minutes, cells were incubated with the prepared FITC-
labeled phalloidin working solution or antibody of anti-β-Catenin at room temperature,
for 30 minutes in the dark. Fluorescent images were obtained by an Olympus fluorescence
microscope (Olympus Corporation, Tokyo, Japan) and the number of melanocyte dendrites
was counted.
RNA ISOLATION AND REAL-TIME QUANTITATIVE PCR (RT-QPCR)
Cell RNAs were isolated using the Invitrogen TRIzol® reagent (Thermo Fisher Scientific,
Massachusetts, USA). cDNAs were synthesized by using the M-MLV reverse transcriptase
kit (Promega Corporation, Wisconsin, USA) and used as the templates for quantitative
polymerase chain reaction (qPCR) (MxPro QPCR Software, Agilent Technologies, USA)
according to manufactural instructions. The primers were as followed: homo glyceraldehyde
3-phosphate dehydrogenase (GAPDH): forward, 5’-ACCCAGAAGACTGTGGATGG-3’,
reverse, 5’-TTCAGCTCAGGGATGACCTT-3’ homo Rac1: forward, 5’-
GAGACGGAGCTGTTGGTAAAA-3’, reverse, 5’- ATAGGCCCAGATTCACTGGTT-3’
homo Rab27a: forward, 5’-ACAACAGTGGGCATTGATTTCA-3’, reverse,
5’-AAGCTACGAAACCTCTCCTGC-3’ mus GAPDH: forward, 5’-ACCCAGAAGAC
TGTGGATGG-3’, reverse, 5’-TTCAGCTCAGGGATGACCTT-3’ mus Rac1: forward,
5’-TCCGCAAACAGATGTGTTCTTA-3’, Reverse, 5’-CGCACCTCAGGATACCACT
TT-3’ mus Rab27a: forward, 5’-TCGGATGGAGATTACGATTACCT-3’, reverse,
5’-TTTTCCCTGAAATCAATGCCCA-3’. qRT-PCR was performed to detect the
expression of related genes according to the following conditions: 95°C for 15 seconds,
55°C for 30 seconds, and 72°C for 30 seconds (40 cycles).
WESTERN BLOT ANALYSIS
Cells were seeded into a 6-well plate at a density of 2 × 10⁵/ml. 20 nM ET-1 was added
to treat cells for 24 hours. Subsequently, cells were treated with different concentrations of
HCP. After 24 hours, radio–immunoprecipitation was used for total protein extraction. The
extracted proteins were then separated by 10% SDS-polyacrylamide gel and transferred to
nitrocellulose filter membranes. After blocking with 5% BSA for 1 hour, membranes were