0 50000 100000 150000 200000 250000
ParticipantParticipant
3
4
Participant
5
Participant
6
Participant
7
Participant
9
ParticipantParticipant
10
13
Hydrolyzed
Not
hydrolyzed
A
0 20000 40000 60000 80000 100000 120000
Participant
3
Participant
4
Participant
5
Participant
6
Participant
7
Participant
9
Participant
10
Participant
13
Hydrolyzed
Not
hydrolyzed
B
0 50000 100000 150000 200000
C
0.05%
0.25%
0.75%
2%
Hydrolyzed
Not
hydrolyzed
d31PAconcentration
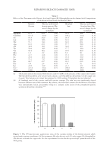
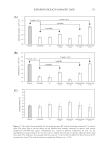
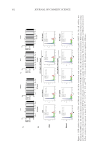
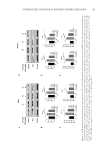
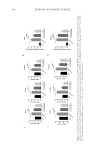
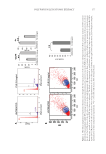
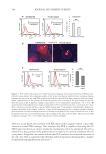
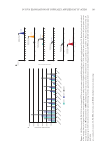
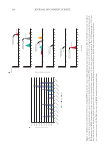
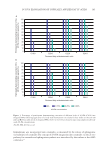
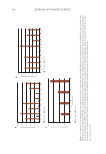
Figure
4.
Formation
of
d29
sphingosine
after
application
of
leave-on
lotion
(A)syndet
,
bar
(B)
and
body
wash
formulations
(C)Acid
.
hydrolysis
of
the
ceramides
was
performed
using
a
modification
of
the
Naoi,
Lee
and
Roseman
method.
(A)
Bar
charts
show
d29
sphingosine
signal
intensity
to
be
greater
after
acid
hydrolysis
following
leave-on
lotion
application.
(B)
Bar
charts
show
d29
sphingosine
signal
intensity
to
be
greater
after
acid
hydrolysis
following
syndet
bar
application.
(C)
Bar
charts
show
the
aggregate
d29
sphingosine
signal
intensity
to
be
greater
after
acid
hydrolysis
following
application
of
all
body
wash
formulations.
cps,
counts
per
second.
196 JOURNAL OF COSMETIC SCIENCE
d29 sphingosine signal intensity )(cps
d29 sphingosine signal intensity )(cps
d29 sphingosine signal intensity )(cps
ParticipantParticipant
3
4
Participant
5
Participant
6
Participant
7
Participant
9
ParticipantParticipant
10
13
Hydrolyzed
Not
hydrolyzed
A
0 20000 40000 60000 80000 100000 120000
Participant
3
Participant
4
Participant
5
Participant
6
Participant
7
Participant
9
Participant
10
Participant
13
Hydrolyzed
Not
hydrolyzed
B
0 50000 100000 150000 200000
C
0.05%
0.25%
0.75%
2%
Hydrolyzed
Not
hydrolyzed
d31PAconcentration
Figure
4.
Formation
of
d29
sphingosine
after
application
of
leave-on
lotion
(A)syndet
,
bar
(B)
and
body
wash
formulations
(C)Acid
.
hydrolysis
of
the
ceramides
was
performed
using
a
modification
of
the
Naoi,
Lee
and
Roseman
method.
(A)
Bar
charts
show
d29
sphingosine
signal
intensity
to
be
greater
after
acid
hydrolysis
following
leave-on
lotion
application.
(B)
Bar
charts
show
d29
sphingosine
signal
intensity
to
be
greater
after
acid
hydrolysis
following
syndet
bar
application.
(C)
Bar
charts
show
the
aggregate
d29
sphingosine
signal
intensity
to
be
greater
after
acid
hydrolysis
following
application
of
all
body
wash
formulations.
cps,
counts
per
second.
196 JOURNAL OF COSMETIC SCIENCE
d29 sphingosine signal intensity )(cps
d29 sphingosine signal intensity )(cps
d29 sphingosine signal intensity )(cps