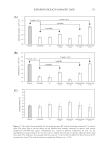
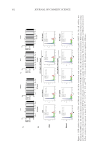
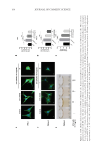
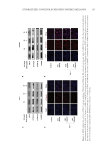
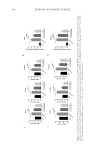
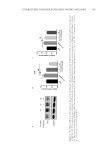
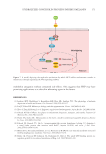
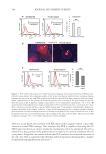
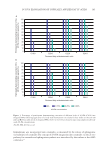
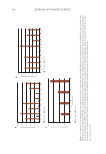
Figure
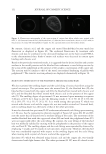
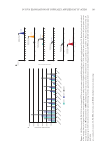
2.
PLE
delays
progression
of
epidermal
keratinocytes
through
the
G2-repair
phase
of
the
cell
cycle.
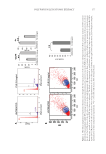
(A)
Representative
flow
cytometry
analyses
of
DNA
content
determined
by
propidium
iodide
(PI)
staining
of
cultured
primary
keratinocytes,
treated
or
not
with
PLE
for
8
days
as
indicated.
Quantitation
of
the
percent
of
cells
in
the
G1
or
the
G2/M
phase
of
the
cell
cycle
is
shown
on
the
right
histograms
(B)
representative
flow
cytometry
analyses
of
light
scatter
parameters
of
cultured
primary
keratinocytes,
treated
or
not
with
PLE
for
8
days,
as
indicated.
The
black
circle
corresponds
to
proliferative
cells
displaying
a
larger
size
typical
of
cells
in
the
DNA
repair
(R)
G2/M
phase
of
the
cell
cycle
(cells
are
twice
as
big).
Quantitation
of
cells
in
this
region
is
shown
on
the
right.
Data
represent
mean
±
SD
of
duplicate
samples,
representative
of
three
independent
experiments.
**p
0.01.
SSC:
Side
Scatter
FSC:
Forward
Scatter.
177 POLYPODIUM LEUCOTOMOS EXTRACT
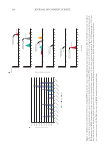
2.
PLE
delays
progression
of
epidermal
keratinocytes
through
the
G2-repair
phase
of
the
cell
cycle.
(A)
Representative
flow
cytometry
analyses
of
DNA
content
determined
by
propidium
iodide
(PI)
staining
of
cultured
primary
keratinocytes,
treated
or
not
with
PLE
for
8
days
as
indicated.
Quantitation
of
the
percent
of
cells
in
the
G1
or
the
G2/M
phase
of
the
cell
cycle
is
shown
on
the
right
histograms
(B)
representative
flow
cytometry
analyses
of
light
scatter
parameters
of
cultured
primary
keratinocytes,
treated
or
not
with
PLE
for
8
days,
as
indicated.
The
black
circle
corresponds
to
proliferative
cells
displaying
a
larger
size
typical
of
cells
in
the
DNA
repair
(R)
G2/M
phase
of
the
cell
cycle
(cells
are
twice
as
big).
Quantitation
of
cells
in
this
region
is
shown
on
the
right.
Data
represent
mean
±
SD
of
duplicate
samples,
representative
of
three
independent
experiments.
**p
0.01.
SSC:
Side
Scatter
FSC:
Forward
Scatter.
177 POLYPODIUM LEUCOTOMOS EXTRACT