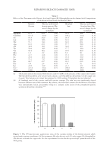
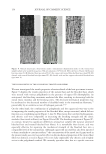
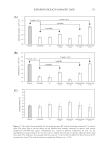
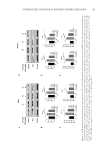
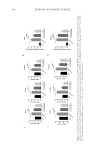
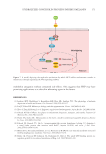
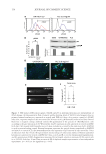
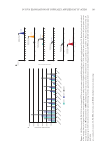
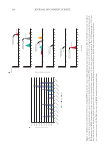
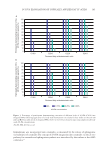
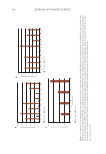
Figure
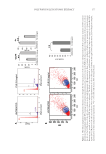
5.
The
effects
of
HCP
on
Wnt/β-catenin
pathway.
Quantification
of
β-Catenin,
p-GSK-3βand
MITF
protein
levels
in
PIG1
(A)
and
MelanA
(B)
cells
by
Image
J
software
for
Figure
4A
and
4B.
Graph
of
β
positive
nuclei
percentage
quantification
in
PIG1
(C)
and
MelanA
(D)
cells
for
Figure
4C
and
4D.
***p
0.001,
ET-1
versus
dimethyl
sulfoxide
(DMSO)
control
#
p
0.05,
##
p
0.01,
###
p
0.01,
HCP
versus
ET-1.
168 JOURNAL OF COSMETIC SCIENCE
5.
The
effects
of
HCP
on
Wnt/β-catenin
pathway.
Quantification
of
β-Catenin,
p-GSK-3βand
MITF
protein
levels
in
PIG1
(A)
and
MelanA
(B)
cells
by
Image
J
software
for
Figure
4A
and
4B.
Graph
of
β
positive
nuclei
percentage
quantification
in
PIG1
(C)
and
MelanA
(D)
cells
for
Figure
4C
and
4D.
***p
0.001,
ET-1
versus
dimethyl
sulfoxide
(DMSO)
control
#
p
0.05,
##
p
0.01,
###
p
0.01,
HCP
versus
ET-1.
168 JOURNAL OF COSMETIC SCIENCE