181 POLYPODIUM LEUCOTOMOS EXTRACT
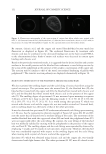
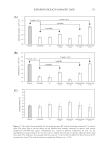
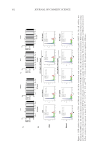
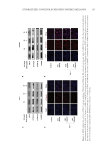
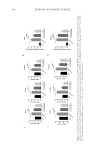
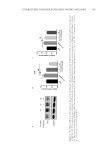
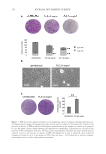
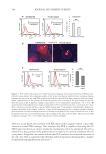
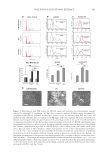
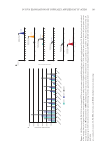
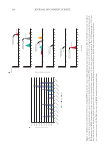
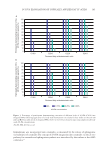
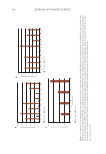
Figure 5. Pretreatment with PLE boosts the γH2AX signal and attenuates the differentiation response
induced by sublethal UV irradiation. (A) Top, flow cytometric analyses of DNA content determined by
propidium iodide (PI) of epidermal keratinocytes, treated or not, as indicated, with PLE for 6 days and
irradiated with sublethal doses (25 mJ/cm2) of UVB light. Cells were analyzed 48 hours postirradiation.
Bottom, bar histogram shows the quantification of the percentage of cells in G1 and S +G2/M normalized
to untreated, nonirradiated cells (B) top, flow cytometry profiles of the levels of γH2AX (solid magenta line)
in epidermal keratinocytes treated as in A. Secondary antibody staining control is shown as a dotted black
line. Bottom, quantification of percent of γH2AX-positive cells according to the gate shown on the plots
above. Data are mean ± SD of duplicate samples representative of two to three independent experiments.
*p 0.05, **p 0.01 (C) flow cytometry profiles of the levels of involucrin (solid red line) in epidermal
keratinocytes as in A. Secondary antibody staining control is shown as a dotted black line. Bottom: bar
histogram: quantification of the percent of involucrin-positive cells according to the gate on the plots above.
Data are mean ± SD of duplicate samples representative of two independent experiments. **p 0.01 and
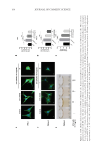
(D) photographs of phase contrast microscopy of cells in A–C, as indicated. Note the differentiated phenotype
in the UV-treated culture, with large cells and shedding, compared with the less differentiated culture when
pretreated with PLE. Scale bar: 50 µm.
Figure 5. Pretreatment with PLE boosts the γH2AX signal and attenuates the differentiation response
induced by sublethal UV irradiation. (A) Top, flow cytometric analyses of DNA content determined by
propidium iodide (PI) of epidermal keratinocytes, treated or not, as indicated, with PLE for 6 days and
irradiated with sublethal doses (25 mJ/cm2) of UVB light. Cells were analyzed 48 hours postirradiation.
Bottom, bar histogram shows the quantification of the percentage of cells in G1 and S +G2/M normalized
to untreated, nonirradiated cells (B) top, flow cytometry profiles of the levels of γH2AX (solid magenta line)
in epidermal keratinocytes treated as in A. Secondary antibody staining control is shown as a dotted black
line. Bottom, quantification of percent of γH2AX-positive cells according to the gate shown on the plots
above. Data are mean ± SD of duplicate samples representative of two to three independent experiments.
*p 0.05, **p 0.01 (C) flow cytometry profiles of the levels of involucrin (solid red line) in epidermal
keratinocytes as in A. Secondary antibody staining control is shown as a dotted black line. Bottom: bar
histogram: quantification of the percent of involucrin-positive cells according to the gate on the plots above.
Data are mean ± SD of duplicate samples representative of two independent experiments. **p 0.01 and
(D) photographs of phase contrast microscopy of cells in A–C, as indicated. Note the differentiated phenotype
in the UV-treated culture, with large cells and shedding, compared with the less differentiated culture when
pretreated with PLE. Scale bar: 50 µm.