236 JOURNAL OF COSMETIC SCIENCE
CLINICAL ASSESSMENT
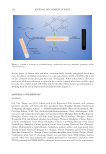
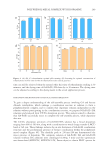
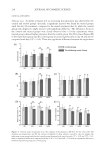
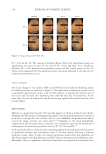
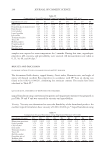
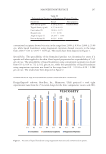
Melasma area. As shown in Figure 4A, an increasing skin glossiness was observed for the
control and treated groups. Specially, a significant increase was found for treated groups
until the day 28 treatments, compared to the initial treatment (day 0), while the control
group only displayed a slight increase with significant difference. The differences between
the control and treated groups were clearly observed after a 14-day experiment, where
treated groups showed higher glossiness than the control group. The ITA values (Figure 4B)
of the experiment group and the control group increased significantly on day 28 and day 56
compared with day 0 (P 0.01). There was significant difference between the experiment
Figure 4. Clinical study of melasma areas. The changes of (A) glossiness, (B) ITA, (C) the value of L*, (D)
melanin area proportion, and (E) the content of melanin of these subjects treated by the test sample (the
whitening serum group) and placebo (control group) along with the varied periods. *P 0.05 and **P 0.01
indicate significant differences compared with day 0. #P 0.05 and ##P 0.01 indicate significant differences
between experiment group and control group.
CLINICAL ASSESSMENT
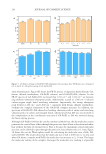
Melasma area. As shown in Figure 4A, an increasing skin glossiness was observed for the
control and treated groups. Specially, a significant increase was found for treated groups
until the day 28 treatments, compared to the initial treatment (day 0), while the control
group only displayed a slight increase with significant difference. The differences between
the control and treated groups were clearly observed after a 14-day experiment, where
treated groups showed higher glossiness than the control group. The ITA values (Figure 4B)
of the experiment group and the control group increased significantly on day 28 and day 56
compared with day 0 (P 0.01). There was significant difference between the experiment
Figure 4. Clinical study of melasma areas. The changes of (A) glossiness, (B) ITA, (C) the value of L*, (D)
melanin area proportion, and (E) the content of melanin of these subjects treated by the test sample (the
whitening serum group) and placebo (control group) along with the varied periods. *P 0.05 and **P 0.01
indicate significant differences compared with day 0. #P 0.05 and ##P 0.01 indicate significant differences
between experiment group and control group.