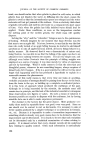
STATISTICAL METHODS IN THE COSMETIC INDUSTRY are presented to the eye in proper form, correlation of many factors can readily be perceived by the eye at a speed which more orthodox methods can detect, but only long after the events have happened. In viewing the chart it is well to bear in mind that production in a factory is not an experiment carried out with that meticulous care which is exercised, or should be, in the actual laboratory and that variations are inevitable. Many of these are not within the ambit of precise control, so that the results of the majestic experiment can only be interpreted when the number of batches is large. In making observations of any series of figures, one must always have in mind what they individually mean. For example, pH values. Too often they are looked on as ordinary figures and variations are interpreted quite wrongly. To take an arithmetical mean except in certain cases in quite wrong since the pH scale is logarithmic. The mid-point between pH 7.5 and 6.5 may be 7, but half-way between pH 4 and pH 5 is certainly not 4.5. It is more like 4.26. The pH unit describes an order of magnitude and the absolute magnitude of a difference in pH value varies according to the position on the pH scale. All values and all things must be looked at in relation to their probable accuracy, their environment and their relative value. With this in mind perhaps my listeners may be asking themselves why they are looking at me ? STATISTICAL METHODS IN THE COSMETIC INDUSTRY: PART III By A. W. MIDDLETON, B.Sc., PH.D., F.R.I.C.* THE USE OF PROBIT ANALYSIS IN THE DEFINITION OF THE PARTICLE SIZE OF AN EMULSION PROBIT ANALYSIS was described in Part II of this series • and subse- quently Stanko, Fiedler and Sperandio•' have published data (Table 2 of their article, p. 43) showing the particle size distribution of seven different emulsions. Their data can be used to provide a more detailed example of the application of probit analysis than that given in Part II, and to show how the particle size of emulsions can be defined by the mean size and the standard deviation of the distribution of log diameters. An emulsion consists of a number of globules of liquid suspended in another liquid in which it is insoluble. When it is manufactured, the sizes of the globules are arbitrarily determined, dependent upon the concentration * Chesebrough Manufacturing Co., Ltd., London, N.W. 10. 159

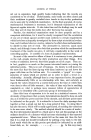
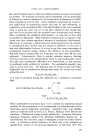
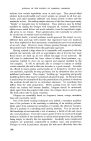
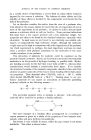
JOURNAL OF THE SOCIETY OF COSMETIC CHEMISTS of surface-active material in the mixture and on the energy transferred from the dispersing apparatus. It is to be expected that the particles will vary either side of the mean size, distributed so that the greater the distance from the mean, the smaller the number of particles at that distance. Thus, if a frequency curve of the distribution were to be drawn, it would be expected to be of the type shown in the distribution curve of Figure 1. It should be noted that particle surface and not particle diameter has been used as the measure of particle size. This has been done because the energy required to form the particle is proportional to the interfacial surface and the incre- ments of energy are likely to be the basic factors distributed either side of their mean: by using particle surface we are indirectly using energy of formation. The number of particles of any surface area at a given distance from the mean will be produced by chance (unless the emul- I UNITS OF PARTICLE SUP, FACE. I FIG. 1 sion has been subjected to some selective treatment such as screening), and the distribution curve will approximate to the Gaussian, or normal, curve more and more closely as a larger number of particles is examined. In that event, the cumulative number of particles smaller (or larger) than a given size will be represented by the area under the normal curve enclosed up to (or beyond) the given particle size--e.g., the shaded part of Figure 1 represents a cumulative number of particles smaller than six units of surface. Now the values of these areas have been tabulated in terms of the devia- tion, expressed as a fraction of the standard deviation of the whole distri- bution, from the mean and the frequency with which the deviation occurs by chance. Since these areas are distributed about the mean, 50 per cent will be positive and 50 per cent negative values, but in order to avoid negative values, which are inconvenient in calculations, 5.0 has been added to all of the area values to give what are called "Probits." We have suggested that the important particle dimension is probably its surface. In a dilute emulsion, the particles will be spheres, in which case their surface, S, equals ,rD •, where D is the diameter. Conversion to logarithms gives log S = 2 log D q- log x and thus by using a log (dia- meter) scale as a measure of particle size we have automatically transformed the diameters to values proportional to the surfaces. It is shown later that these premises are correct. 160
Purchased for the exclusive use of nofirst nolast (unknown)
From: SCC Media Library & Resource Center (library.scconline.org)