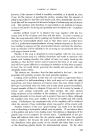
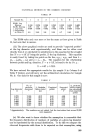
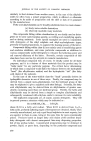
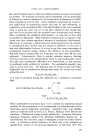
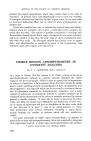
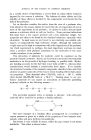
STATISTICAL METHODS IN THE COSMETIC INDUSTRY The analytical technique follows: The data of their Table 2 is first rearranged to show the cumulative percentages of particles smaller than the upper limit of their size range, to give our Table I. TABLE I Particle Size Distribution of the Different Emulsions Source: Ref. 12. Particle % smaller than the stated size Diameter. Sample No. Microns 1 2 I 3 4 5 6 7 1.9 58.4 53.8 42.2 46.3 57.0 37.3 23.6 3.9 78.7 77.7 66.2 75.6 79.6 61-8 67.2 5.9 84.2 85.2 76.3 85.6 84.8 74-1 85.6 7.9 88.3 89-4 82.2 90.6 87.8 82.9 92.1 9.9 90.9 92.1 86.0 93.9 90-4 87.8 95.4 11.9 92.2 93-5 88.7 95.2 92.2 90.3 96.1 GRAPHICAL ANALYSIS These results can be plotted on log-probability paper, putting the particle diameter on the log scale and the cumulative per cent smaller on the probability scale. This gives graphs similar to that shown for two emulsions (Nos. 3 and 1) in Graph 1 and from which can be read the mean effective 10 •0 50 70 90 20 40 60 80 GRAPH 1 os 04 Oa x o 4 S S 0 S,S e,o e s GRAPH 2 161

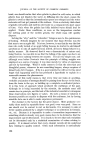
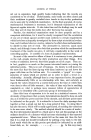
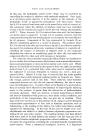
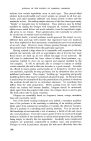
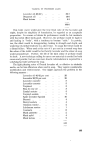
JOURNAL OF THE SOCIETY OF COSMETIC CHEMISTS diameter, ED50, which, as the distribution is symmetrical, is also the diameter either side of which lie 50 per cent of the particles. We can also ' obtain an estimate of s, the estimated •, this being the diameter at 84.13 per cent, divided by that at 50 per cent. Divided, because the diameter scale is logarithmic and subtraction of the length of the scale at 50 per cent from that at 84.13 per cent is equivalent to division of the numerical value of the diameter at the one point by that at the other. Our results are: TABLE II Sample No. 1 2 3 4 5 6 7 ED50, microns 1.40 1.47 2.23 2.04 1.40 2.70 2.95 s microns 5.6 3.7 3.7 2.6 5.6 3.0 2.0 It is apparent that it is worth while to analyse the data in more detail and the appropriate first steps are ß (i) Convert the "cumulative percentages smaller" to probits (the probits directly derived from the data are called "empirical probits," tables of which are in most books of statistics, e.g., Refs. 10 and 13) and the diameter of the largest particles in any group to log microns. This gives: TABLE III Empirical probit of cumulative % smaller Log•0 microns 1 2 3 4 5 6 7 0.279 5.21 5.10 4.80 4.91 5-18 4.68 4.28 0.591 5.80 5.76 5.42 5.69 5.83 5.30 5.45 0.771 6.00 6.05 5.72 6.06 6.03 5.65 6.06 0.898 6.19 6.25 5.92 6-32 6.17 5.95 6.41 0.996 6.33 6.41 6.08 6.55 6.30 6.17 6.68 1.076 6.42 6.51 6.21 6.66 6.42 6.30 6.76 (ii) These empirical probits are now plotted on arithmetical graph paper and the best fitting line drawn to them by eye. In fitting this line to the points, attention should be paid to placing it so that on one side of the line the sum of the differences, in probits, of the points and the line, at the same log diameter, is the same as the sum of those on the other side of the line. The appropriate lines for emulsions Nos. 3 and 4 are shown in Graph 2. As described in Part II (ii), they can be used to provide estimates of ED50 and of s. They give: 162
Purchased for the exclusive use of nofirst nolast (unknown)
From: SCC Media Library & Resource Center (library.scconline.org)