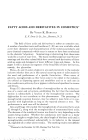
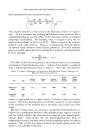
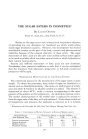
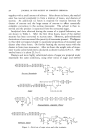
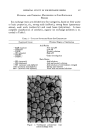
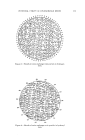
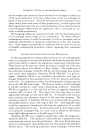
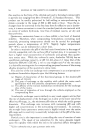
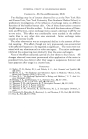
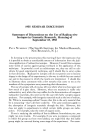
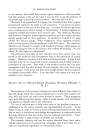
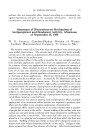
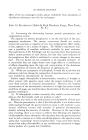
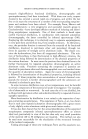
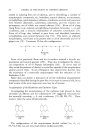
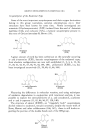
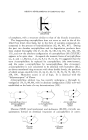
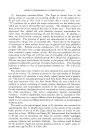
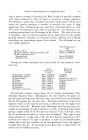
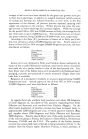
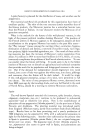
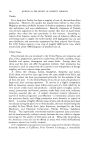
POTENTIAL UTILITY OF ION-EXCHANGE RESINS 259 Figure 3.--Sketch of cation exchange resin particle in hydrogen form. OH OH o:.: o. O8 O• O• }• O• O• Figure 4.•Sketch of anion exchange resin particle in hydroxyl form.

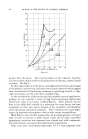
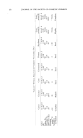
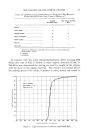
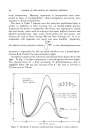
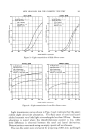
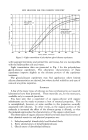
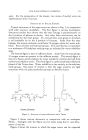
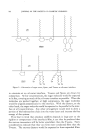
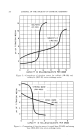
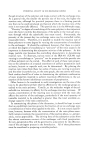
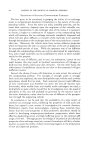
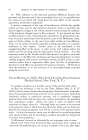
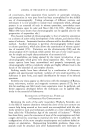
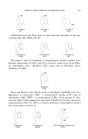
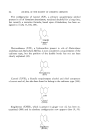
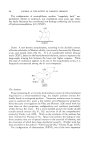
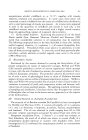
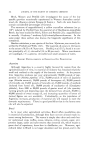
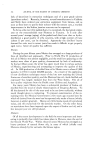
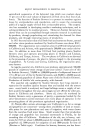
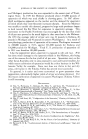
260 JOURNAL OF THE SOCIETY OF COSMETIC CHEMISTS z SULFONIC• (IR-120) ( / CARBOXY/(ITC-50) ./ 12 10 8 6 2 "' 4 o 2 4 6 8 10 12 CAPACITY IN MILLIEQUIVALENTS PER GRAM Figure 5.--Comparison of titration curves for sulfonic (IR-120) and carboxylic (IRC-50) cation exchange resins. 12 z B '•STRONG BASE (IRA-400) • WEAK BASE -• (IR-4B) 0 2 4 6 8 CAPACITY IN MILLIEQUIVALENTS PEr GRAM Figure &--Comparison of titration curves for weak base (IR-4B) and strong base (IRA-400) type anion exchange resins.
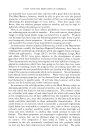
Purchased for the exclusive use of nofirst nolast (unknown)
From: SCC Media Library & Resource Center (library.scconline.org)