THE USE OF INFRARED SPECTROSCOPY IN STUDYING THE COMPOSITION OF ESSENTIAL OILS By CHA•I. ES L. TEITELBAUM* Presented June 4, 1958, New York City A NUMBER OF previous publications have described what infrared spectroscopy can do and is doing as an analytical and control technique for essential oils. Quite early its proponents hailed it as being of almost revolutionary significance and it might have been inferred that if only it were adopted in place of all other techniques, the millenium would have arrived. All one would have to do would be to place a drop of the essential oil in question into this piece of modern wizardry, press a button, and all problems would disappear. This is not meant to be disparaging of infrared spectroscopy and spec- troscopists because this tool has proved to be of tremendous value. It is just that each new analytical method seems to go through the same cycle. When it is discovered, a spate of articles appear showing its application to many fields and, unfortunately, it is seen by some as the sole answer to all their problems. Only after a while is the whole matter brought into perspective and then the technique takes its proper place in our arsenal of chemical tools. It appears that the new technique of vapor-phase chromatography is going through this process at the present time. Experience has shown that the chemical problems involved in work on essential oils can only be successfully solved by judicious combinations of several techniques. It so happens that the combinations that we have found most successful contain a generous portion of infrared spectroscopy. This article describes the ways infrared spectra were used in conjunction with other techniques in investigating the constitution of a particular essential oil. Unfortunately, it is not possible to disclose the identity of this essential oil. However, a few of the constituents that were found will be mentioned to illustrate the main theme, the general plan of attack and the specific methods used to investigate the constitution of this es- sential oil. * Work done while at Battelle Memorial Institute, Columbus 1, Ohio. Coty, Inc., New York 19, N.Y. 377 Present address

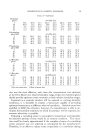
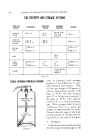
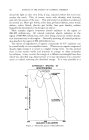
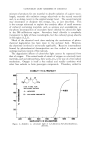
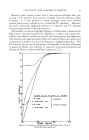
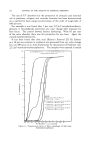
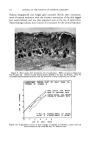
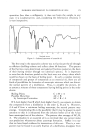
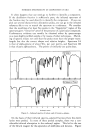
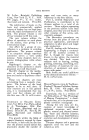
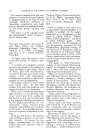
378 JOURNAL OF THE SOCIETY OF COSMETIC CHEMISTS In the last decade or so there has been a very great change in the methods used in investigations on the composition of essential oils. Previously, the chemist had to rely on distillation and a few chemical-type separations for parting and purifying the constituents, and on the conventional physical constants such as refractive index, density, and melting and boiling points for identification. Supplementing these physicochemical techniques, of course, was the ever important use of olfactory observations. These methods still have their value but are now supplemented by liquid and gas chromatography, improved chemical separation, clathrate formation and the various types of spectroscopy. A prime prerequisite for doing this type of work is that of having a team approach. Specifically, the team consists of a spectroscopist, an organic chemist, and, when required, a perfumer or fiavorist. It requires not only the closest kind of cooperation to make the team effective, but also an appreciation by each member of the team of the potentialities and limita- tions of all of the techniques used in the study. The next and more tedious step is concerned with amassing a library of infrared spectra. A good deal can be told about the structure of a compound from its infrared spectrum. However, in order to positively identify it, its spectrum must be compared with that of an authentic speci- men. While many infrared spectra of essential oil components have been published, the large majority of them have not. Thus, for our work, it was necessary to obtain a large number of infrared spectra not only from the literature but also those of samples of essential oil constituents we were able to obtain from various sources. The spectral data were transferred to punched cards. It is possible now to take an isolate from an essential oil, determine its spectrum and, in a matter of minutes, compare its spectrum with all of those in our file by use of an electronic sorting device. DIscussIoN Figure 1 shows the infrared spectrum of a whole essential oil. In the low wavelength part of the spectrum, from 2 to about 7 microns, is the region where absorption peaks occur due to functional groups or parts of molecules. There are different peaks caused by the hydroxyl, carbon- hydrogen, carboxyl, carbonyl and olefin groups. There are other group absorptions which are too weak to be seen here but which show up in the spectra of the isolates. On the right-hand side is the so-called "finger- print" region of the spectrum. This is where absorption peaks occur due to whole molecules. These are the peaks that are characteristic of each compound and which can be used to identify it. Determination of an infrared spectrum is not only valuable, it is also convenient. It takes about fifteen minutes it can be done with small
Purchased for the exclusive use of nofirst nolast (unknown)
From: SCC Media Library & Resource Center (library.scconline.org)