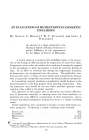
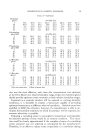
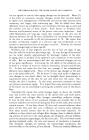
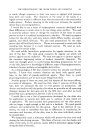
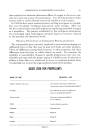
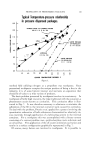
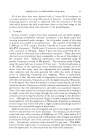
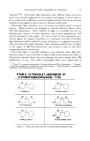
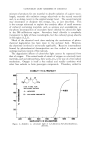
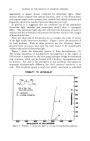
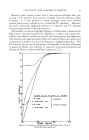
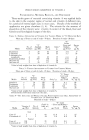
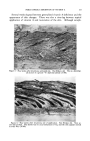
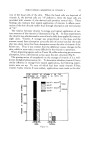
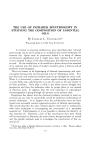
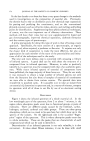
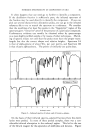
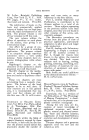
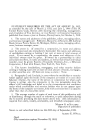
INFRARED SPECTROSCOPY IN COMPOSITION OF OILS 379 quantities (less than a milligram) it does not harm the sample in any way it is nondestructive and, considering the information obtained, it is very inexpensive. 2 3 6 7 8 9 10 11 12 13 14 15 Wavelengi'h, microns Figure 1.--Infrared spectrum of essential oil. The first step in the separation scheme was to fractionate the oil through an efficient distilling column and collect about 40 fractions The spectra of the fractions were determined and selected fractions pooled on the basis of their having similar (though not identical) spectra. It is important to note that the fractions pooled on this basis were not always those which would be chosen on the basis of boiling point. In such a complex mixture of compounds and groups of compounds as an essential oil, there are all kinds of possibilities for formation of azeotropic mixtures which can distort the normal pattern of a distillation. Thus, to simplify the picture, let us assume a mixture of three components having boiling points in the order shown: Boiling Points C B A Possible Distortion AC B by Azeotrope Formation AC B A If A boils higher than B which boils higher than C, one expects to obtain the components from a distillation in the order C, B and A. However, if A and C form a minimum boiling azeotrope, the second pattern may emerge. Complicating this is the possibility that C may be present in small amounts so that it is exhausted from the solution before all of the A has been azeotroped out of the solution. The pattern then emerges of AC, B, A. The situation in an essential oil is so involved that one cannot make any predictions whatsoever about azeotrope formation. SufFice it to say that we have found evidence for interactions of this sort. That is, a com- ponent may be found in an early fraction of a distillation, disappear from

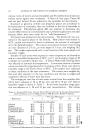
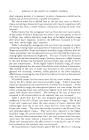
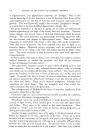
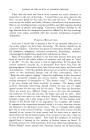
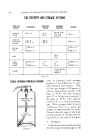
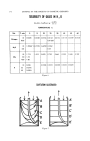
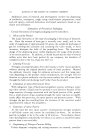
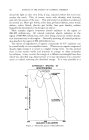
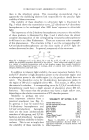
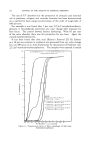
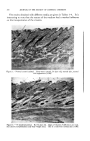
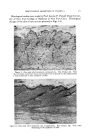
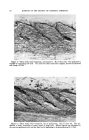
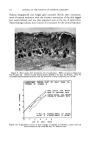
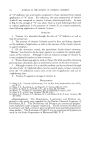
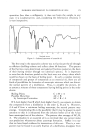
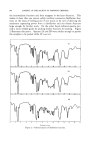
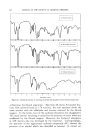
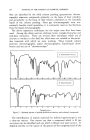
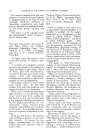
380 JOURNAL OF THE SOCIETY OF COSMETIC CHEMISTS the intermediate fractions and then reappear in the later fractions. This makes it clear that one cannot safely combine successive distillation frac- tions on the basis of boiling point if one wants to be sure of deriving the maximum separating power from a distillation and yet obtain fractions large enough for further work. On the other hand, infrared spectra pro- vide a more reliable guide for picking similar fractions for pooling. Figure 2 illustrates this point. Spectra 2A and 2B were similar enough to permit the samples to be pooled while 2C was not. (b) I I i 4 • f (c) 3 I I I I I I I I I I I 4 5 6 7 8 9 10 II 12 13 14 15 Wavelength, microns Figure 2.--Infrared spectra of distillation fractions.
Purchased for the exclusive use of nofirst nolast (unknown)
From: SCC Media Library & Resource Center (library.scconline.org)