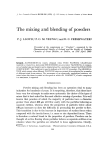
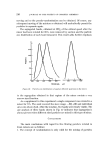
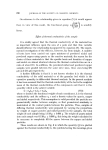
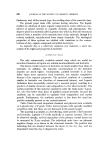
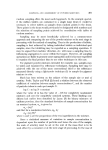
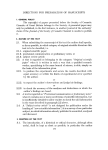
I..•PONITt' CLAY---A SYNTtlETIC INORGANIC GELLING AGENT 241 of the down curve, and the intercept on the shear stress axis was measured. This Extropolated Shear Stress is shown in our results as ESS. While it is understood that this is not a true yield value, it is convenient to refer to it as such. The plastic viscosity (PV) of the dispersion was calculated from the slope of the same line. optical densit3, (O.D.). Since the fully dispersed Laponite CP system is clear and the floc- culated system is very cloudy, it is convenient to follow the course of flocculation by measuring the optical density. This was done on an EEL Absoptiometer, using a 20 mm cell and a Green-Blue Filter No. 603. In some systems, where the viscosity and yield value of the medium were high, the inclusion of air bubbles was unavoidable, and the OD could not be measured. In these cases, the clarity was estimated visually. SCOPE OF THE WORK initially a series of solutions was prepared from each organic compound, and 2% Laponite CP was added. It was found that, as the concentration of the organic compound increased, the dispersions became very slightly cloudy, until a point was reached when further increase caused gross flocculation, i.e. a great increase in cloudiness. For the study of the effects of clay and electrolyte concentration, convenient high concentrations of organic compound that still gave an almost clear dispersion were selected. The clay concentrations were not taken any higher than could be readily measured on the Ferranti-Shirley viscometer. The consistency correspond- ing to the highest values recorded was somewhat similar to that of petrol- eum jelly. There is no reason why higher clay concentrations should not be used, though good dispersion would require the use of high shear mixing equipment. The effect of varying electrolyte concentrations was examined at 2% clay concentration. The trends observed would, of course, be similar at other clay concentrations. RESULTS The results of the preliminary investigation in which the concen- trations of organic compounds were varied at 2% clay concentration are shown in Fig. I. On these, as on all following figures, the ESS and OD values are plotted on the same graph.

242 JOURNAL OF THE SOCIETY OF COSMETIC CHEMISTS It is seen that the OD values are low, i.e. the dispersions are clear up to a fairly high concentration, and then suddenly increase. There is even a slight and unexpected improvement of clarity at low concentrations of organic compound. The ESS values increase up to a sharp peak which corresponds to the sudden onset of cloudiness. The three alcohols tested show a small dip at low concentration before the values begin to rise. elhonol 5o Ethanol _ 100 0 50 -- -- Iso propanal .... _. i oo o 50 Acetone ioo o .50 30 - 50 0 - 60 - 70 I00 Concentrohon of organic compound, % 150 / 1oo Ethylene glycol Sarbdol 50 •00 Glycerol o 5o IOO 0 5i0 0 --I0 -- 20 -- 40 .-- - 50 0 -- 60 -- 70 0 0 Concentration of argoinc compound, % Figure 1. Elfcot of concentration o[ various organic compounds on the ESS and optical density of 2 • Laponite CP dispersion.
Purchased for the exclusive use of nofirst nolast (unknown)
From: SCC Media Library & Resource Center (library.scconline.org)