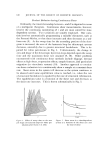
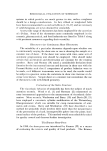
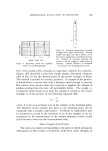
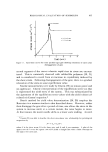
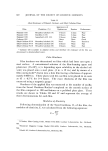
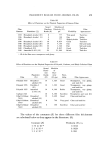
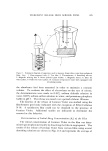
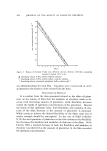
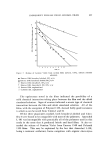
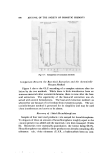
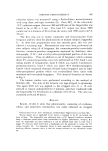
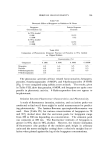
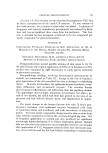
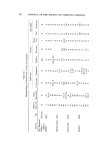
656 JOURNAL OF THE SOCIETY OF COSMETIC CHEMISTS yield value of the system. Two useful approaches to shear strength de- termination are those of Pryce Jones (27) and Bruss (28, 29). Pryce Jones attempted to characterize thixotropic systems by rotating the inner cylinder of a Couette rheometer through a certain angle, re- leasing the cylinder, and then noting the rate of its return to its original position. When the sample in the gap had a gel strength of zero, the inner cylinder returned to its original position. A finite deflection of the rotor was indicative of structure formation and the extent of deflec- tion, of gel strength. A similar procedure was utilized in our labora- tories with the Rotovisco to permit measurements of gel structure and gel strength. In all instances, the SV-II "profiled" (ribbed) rotor-and-cup assembly was employed in conjunction with a ZG-100 gear reducing box to reduce the rate of rotation by a factor of 100. After attachment of the coverplate and rotor to the spindle of the Rotovisco measuring head, 9.5 ml of an agar sol were pipetted into the SV cup. The cup was im- mediately pushed up around the rotor and secured in place. Drops of water were placed on the coverplate and Saran wrap was taped in place around the entire measuring system and temperature control assembly to prevent drying out of the gel sample during the time allotted for its maturation. At the conclusion of the aging period, the gear shift lever was engaged at the lowest gear selection setting, i.e., 162, for exactly 10 minutes and the rate of stress increase in the system was noted. Time intervals longer than ca. 10 minutes permitted the development of stress to levels beyond the capability of the Rotovisco measuring head em- ployed (500 g cm torque limit) intervals of less than 10 minutes did not result in stress values which were in the more accurate range of the mea- suring system. Preliminary studies had shown none of the gels to un- dergo rheodestruction within a 10-minute period. The gear was dis- engaged after 10 minutes and the relaxation of stress in the system was noted. Eventually, a point was reached at which no further relaxation occurred. Stress-time data were obtained for agar gels up to concentra- tions of 4.0% w/w. Typical stress-time curves are shown in Fig. 11. Prior to the disengagement of the gear, the stress-time curves are characterized by two distinct linear portions. Stress in the system ini- tially increases at a relatively slow rate. After about 9 to 10 minutes, a marked increase in stress is encountered. The first segment of the biphasic curves could be an artifact--this seems likely as agar gels of dif- ferent concentration differ little from one another in initial stress de- velopment in this system. The differences in the samples arise in the

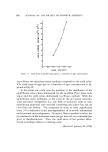
RHEOLOGICAI. EVALUATION OF SEMISOLIDS 657 Io 8 x z • 4 q• gear disengaged I I 5 lo ß 2.0 % w/w agar ß 1.0 %w/wagar I I I 15 20 25 TIME CM•N.) Figure 11. Stress-time curves for some purified agar gels showing relaxation of stress after disengagement of gear second segment of the curves wherein rapid rises in stress are encoun- tered. This is commonly observed with rubberlike polymers (30, $1) and is considered to result from an increase in crystallinity induced by the shear strain. Following disengagement of the gear, there is a gradual relaxation of the stress to some equilibrium value. Similar measurements were made by Charm (32) on tomato puree and on applesauce. Charm's interpretat. ign of the equilibrium stress was that it represented the yield stress of the system. , This was substantiated by the agreement of the equilibrium stress values with the yield values cal- culated via Casson's equation. • Bruss's method for yield value, determination (2• 29) employs the Rotovisco in a manner similar to that described above. However, rather than disengage the gear after a period of time, one allows the stress in the system to increase until, at a certain instant, the rotor begins to move. At that instant, the meter needle shifts to a lower scale reading. Accord- * Casson (33) was able to describe thc shear stress-shear rate rclationship for printing-ink suspensions by F ø'• = k o q- k•D ø-•, where F is thc shear stress, D is thc shear rate, and ko and kx are constants. A plot of the square root of F versus the square root of D yields a straight line with a finitc intercept on the square root-stress axis.
Purchased for the exclusive use of nofirst nolast (unknown)
From: SCC Media Library & Resource Center (library.scconline.org)