J. Soc. Cosmet. Chem. 25 183-202 (1974) ¸ 1974 Society of Cosmetic Chemists of Great Britain Response of the frog olfactory system to controlled odour stimuli T. MICHAEL POYNDER* Presented at the 2nd Joint Perfumery Symposium organized by the British Society of PerJkmers and the Society of Cosmetic Chemists of Great Britain at Eastbourne on 7-9th May 1973 Synopsis--The electrical events which occur in the nose of a frog when it is stimulated with ODORANTS have been studied. For this study new techniques were developed for applying STIMULI of known composition and controlled concentration in a reproducible manner. The concentration and timing of the stimuli in the nose cavity has been monitored by means of a new device consisting of a sampling probe connected to a FLAME IONIZATION DETECTOR. The ranges of concentration used have been wider than those reported previously and the form of the relationship between concentration and response size is now seen more dearly. It is that to be expected for a Langrnuir type ADSORPTION of odorant molecules on the RE- CEPTOR surface. INTRODUCTION This investigation concerns the slow changes of electric potential which take place at the surface of an animal's olfactory mucosa when it is stimulated by an odorant. These changes can be observed only in the region of the olfactory receptor cells and can be presumed to result from processes essential to olfactory perception. Their study should therefore help towards an understanding of the receptor mechanism. In practice the changes in electric potential are recorded using a pair of electrodes, one of small tip diameter placed on the surface of the olfactory *Bush Boake Allen Ltd, London El5 and the Department of Physiology, University College London, London WC1E 6BT. 183

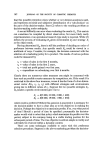
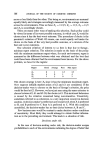
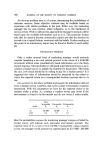
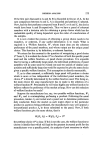
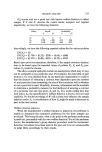
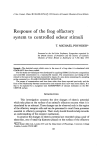
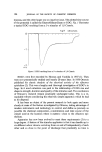
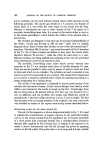
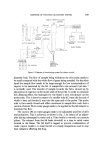
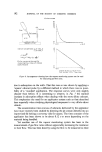
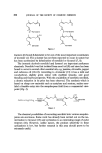
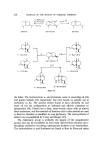
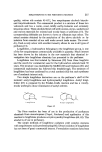
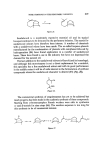
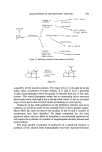
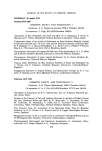
184 JOURNAL OF THE SOCIETY OF COSMETIC CHEMISTS mucosa, and the other larger one on inactive tissue. The plotted time course of the potential is called the ElectroOlfactoGram or EOG. Fig. 1 illustrates a typical EOG resulting from a 5-s stimulus of 1,8 Cineole. half seconds I I I I I I Figure 1. EOG resulting from a 5-s stimulus of 1,8 Cineole. EOG's wero first recorded by Hosoya and Yashida in 1937 (1). They were not systematically studied until nearly 20 years later. In 1956 Ottoson published his classic Analysis of the electrical activity of the olfactory epithelium (2). This was a lengthy and thorough investigation of EOG's in frogs. In it much attention was paid to the relationship of EOG size and shape to strength, duration and quality of the stimulus used. The conclusions of Ottoson's research remain practically unchanged today. This is a re- markable tribute considering the relatively simple apparatus which he had at his disposal. It has been an object of the present research to look again and more closely at some of the factors investigated by Ottoson, taking advantage of modern instruments and technology to control and define as precisely as possible the chemical composition, concentration and time course of the stimuli used at the location where it matters--close to the olfactory epi- thelium. Apparatus has now been evolved to meet these requirements (3) to a large degree. A feature of the stimulus applicator is that it can handle up to six different odour streams switching them on and off independently of each other and so close to the point of discharge that practically no time is
Purchased for the exclusive use of nofirst nolast (unknown)
From: SCC Media Library & Resource Center (library.scconline.org)