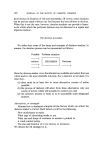
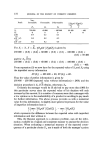
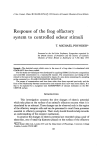
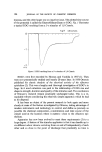
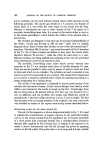
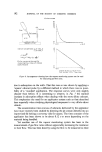
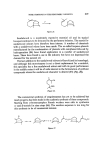
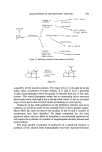
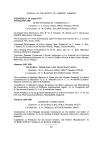
RESPONSE OF THE FROG OLFACTORY SYSTEM 193 an organic vapour from a nearly enclosed space of known volume. The concentration in this enclosed space is kept uniform by mechanical mixing (if diffusion alone is not adequate) and is measured continuously by the vapour monitor. The arrangement is illustrated in Fig. 8. The volume of enclosed space divided by the time constant of the exponential fall in concentration gives the flow rate of the eluting gas. This method has been used with advantage to measure the flow of gas from the applicator nozzle where back-pressure of most conventional flow meters would have altered the flow being measured. This concludes the description of the apparatus for generating, applying and monitoring odour stimuli. It has been somewhat detailed because it is hoped that some of the ideas will be useful to those researching in this field and perhaps to others also. Moreover it seems desirable to place more emphasis on this side of any study of stimulus-response relationships than has been accorded hitherto. There is now the means of investigating more thoroughly firstly the relationship between stimulus concentration and physiological response, secondly the interactions between different odours applied simultaneously or sequentially and thirdly the time course of physiological events following an odour stimulus. All these can provide useful information about olfactory receptor mechanisms and it is with the first that the experimental part of this paper is concerned. The electrode system for recording EOG's The electrodes used for recording EOG's were similar to those used by Ottoson (3). The recording electrode was a Pyrex glass pipette having a tip diameter of 50-100 gm and filled with normal saline containing 2• agar. Electrical connection was through a AgC1-Ag wire inserted in the pipette. The second electrode was a AgC1-Ag plate wrapped in lint, soaked in normal saline and inserted in the frog's mouth. The signals picked up by these electrodes were led to a high input resistance preamplifier, a main amplifier and the EOG's recorded on a strip chart. Procedure for EOG experiments In each experiment one frog was used for the study of EOG's resulting from one odorant chemical at different concentrations. The vaporizer tubes were charged with the odorant made up to different dilutions with a suitable solvent (usually deodorized light paraffin oil). Typically the dilutions were chosen so that the applicator delivered a set of stimuli in which each was 10

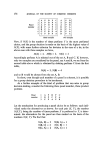
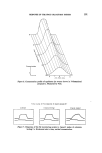
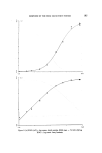
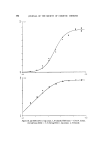
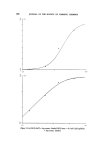
194 JOURNAL OF THE SOCIETY OF COSMETIC CHEMISTS times weaker than the preceding one. Stimuli of intermediate strength were obtained by altering the gas flows in each channel by a factor of three. In this way stimuli having concentrations covering up to four decades in half decade steps were available. The actual concentrations of stimuli were, of course, measured by the vapour monitoring system and this was done just before an experiment with a frog. Arbitrary units were used since for the purpose of the present investigation this was all that was necessary. In the case of certain odorants the lowest concentration gave fid signals obscured by noise and several readings had to be averaged to arrive at an estimate. An anaesthetized frog was prepared and placed in a head holder. The applicator was positioned with its nozzle pointing into the opened nasal cavity and about 4 mm away from it. The recording electrode was lowered by means of a micromanipulator so that its tip just touched the surface of the mucus overlying the eminentia olfactoria. The recordings required for this investigation were of the peak EOG voltages which are in fact reached soon after the onset of stimuli (see Fig. 1). Stimuli could therefore be switched off as soon as this peak voltage had been reached and doing this helped to minimize fatigue effects especially for strong stimuli. Also to combat fatigue 2 or 3 min were allowed for re- covery between each stimulation with the higher concentrations. The stimuli were usually applied in both ascending and descending order of concentration so that two EOG readings were obtained at each concen- tration. The odorant chemicals for which EOG data are reported in this paper are: Amyl acetate, 1,8 Cineole, Linalol, and Butyl acetate. RESULTS The results are shown entirely in the form of graphs on which all the experimentally determined points are plotted. These graphs are shown in Figs. 9-13. The abscissae in every case are the logarithms (base 10) of the concen- trations in arbitrary units of the stimuli used. The EOG amplitudes in milli- volts are plotted as the corresponding ordinates in Figs 9(a), 10(a), II(a),
Purchased for the exclusive use of nofirst nolast (unknown)
From: SCC Media Library & Resource Center (library.scconline.org)