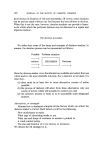
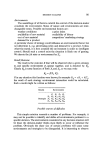
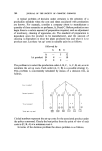
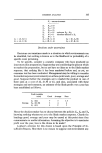
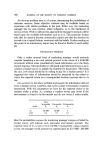
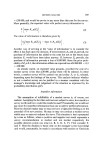
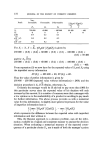
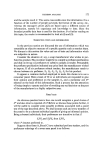
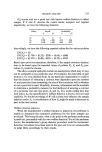
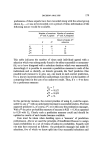
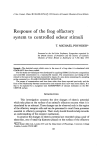
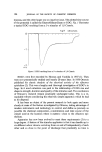
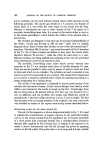
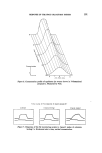
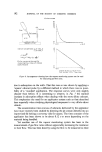
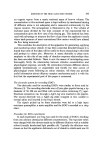
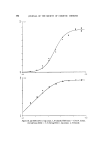
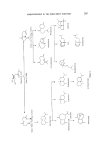
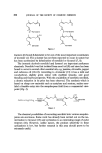
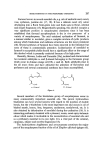
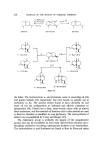
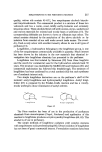
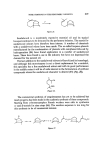
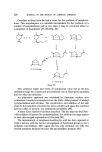
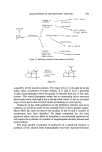
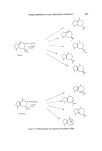
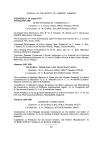
RESPONSE OF THE FROG OLFACTORY SYSTEM 191 Concentration 2 I O I 2 mm from axis Figure 6. Concentration profile of applicator jet stream shown in 3-dimensional perspective. Measured by Fido. Time course of Fido responce to s•uare pulses of- Acetone Cineole (strong) C[neole (weak) Figure 7. Response of the fid monitoring system to 'square' pulses of odorants lasting 2 s. Horizontal axis is time, vertical concentration.

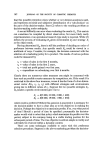
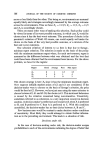
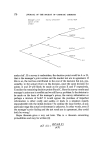
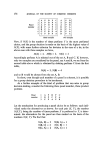
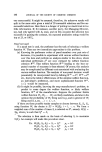
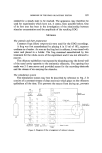
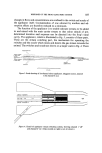
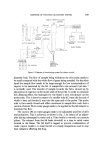
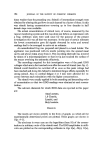
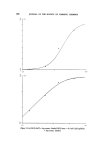
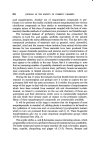
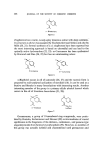
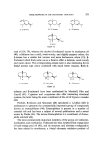
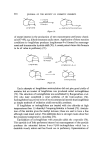
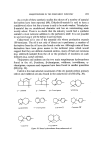
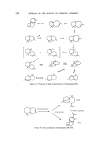
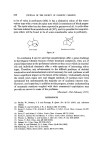
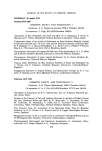
192 JOURNAL OF THE SOCIETY OF COSMETIC CHEMISTS Elution curves o Air Fido •, I oe ml/min -'"--z-•_•¾ Foil cover,• •-' Mogne ? stirrer--'-] ß o,o -14.0 Odoront concentration ½o at time• ½ at time, C=COE, V Loglo c = JOglO c O- •V t ElutJon curves can be used for measuring flow rotes with minimal back pressure 0 ß 0.0, -14 0 Cineole elution curve 13-3.72 Fido current (PA)v Time (rain) Figure 8. Arrangement showing how the vapour monitoring system can be used for measuring gas flow rates. due to adsorption on the walls. That this was so was shown by applying a 'square' odorant pulse by a different method in which there was no possi- bility of a 'rounded' application. The response curves were only slightly sharper than before. It is interesting to observe, in Fig. 7 the marked increase in adsorption effects when dealing with the more dilute odorant. This emphasizes the need for an applicator system such as that described here especially when studying physiological responses to very dilute odour stimuli. The concentration time courses of odorants delivered by the applicator have more recently been studied by directing the jet stream directly into an improvised fid having a cut-away side for access. The time constant of the applicator has been shown to be about 0.12 s or more depending on the material being handled. Yet another use of the vapour monitoring system has been in the measurement of gas flow rates without appreciably increasing the resistance to their flow. This has been done by using the flow to be measured to elute
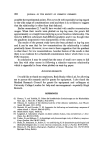
Purchased for the exclusive use of nofirst nolast (unknown)
From: SCC Media Library & Resource Center (library.scconline.org)