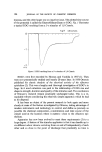
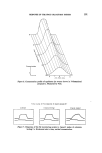
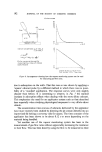
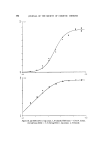
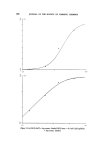
RESPONSE OF THE FROG OLFACTORY SYSTEM 201 Then the potential, Vt, across the constant resistance, Rt, is given by R t R t + R m If membrane conductance, Gm, is 1/R m then V t = E. Rt'Gm 1 + G m R t (1) If it is assumed that the membrane conductance is a linear function of odorant concentration, G m = k.c, then kc Vt = E'Rt' 1 + kc R t V is to be our estimate of the EOG so that EOG -• _,•c 1 + Bc ' where A and B are constants. Up to this point the argument has followed that of Tucke? and Shibuya (6). But the above assumption that the membrane conductance is a linear function of concentration is clearly not correct because a saturation must soon be reached. Instead let us assume that there is a limited number of gates in the membrane corresponding to a maximum conductance of G•. Then, analogous to the Langrnuir adsorption isotherm, we have kc 1 +kc where k is a constant. Combining this with equation (1) we get E. Rt.G•.k.c 1 + (k + Gu. Rt.k).c _,'•c so EOG - where A and B are constants as before. (2) 1 +Bc Therefore it may after all be expected that the EOG's would follow equation (2). The curves plotted on the graphs of results are in fact those obtained from equation (2) with values of A and B chosen to make them fit as well as

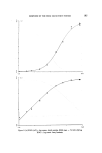
202 JOURNAL OF THE SOCIETY OF COSMETIC CHEMISTS possible the experimental points. The curves fit well especially having regard to the wide range of concentrations used and there is no evidence to suggest that the relationship is other than that deduced. Earlier researchers (2, 7 and 8) have worked with smaller concentration ranges. When their results were plotted on log-log axes, the points fell approximately on straight lines implying a power function relationship. The lines for different substances had different gradients and it was thought that the gradients (exponents) were characteristic of the substance. The results of the present study have also been plotted on log-log axes and it can be seen that for low concentrations the relationship is indeed practically linear. However, in no case is there suggestion that the gradient is other than 1 for low concentrations. Another feature of the results is that there is no evidence for a threshold concentration below which there is no EOG response. In conclusion it may be noted that the sense of smell now seems to fall into line with other senses in following a stimulus-response relationship which is sigmoidal in form when plotted on semi-log paper. ACKNOWLEDGMENTS I would like to thank my employers, Bush Boake Allen Ltd, for allowing me to pursue this research and for grants for equipment. I also thank the Medical Research Council for grants for equipment and colleagues at University College London for help and encouragement--especially Hugh Bostock. (1) Hosoya, Y. and Yashida, H. Ueber die bioelektrische Erscheinungen an der Riechschleim haut. Jap. J. Med. Set. 3 Biophys. 8 22 (1937). (2) Ottoson, D. Analysis of the electrical activity of the olfactory epithelium. Acta Physiol. Scand. 35 suppl. 122 1 (1956). (3) Bostock, H. and Poynder, T. M. Apparatus for delivering and monitoring a sequence of odour stimuli. o r. Physiol. 224 14P (1972). (4) British Patent Appln. 10851/72. (5) Langmuir, i. Adsorption of gases on plane surfaces of glass, mica and platinum. J. Amer. Chem. $oc. 40 1361 (1918). (6) Tucker, D. and Shibuya, T. A physiologic and pharmacologic study of olfactory receptors. $yrnl•. Qualitat. Biol. 30 207 (1965). (7) Drake, B., Johansson, B., Sydow, E. yon and Dqbving, K. B. Quantitative psychological and electrophysiological data on some odorous compounds. Scand. J, Psychol. 10 89 (1969). (8) Ottoson, D. The electro-olfactogram. Handbook of Sensory Physiology Vol. IV/I95 (1972) (Springer-Verlag, Berlin).
Purchased for the exclusive use of nofirst nolast (unknown)
From: SCC Media Library & Resource Center (library.scconline.org)