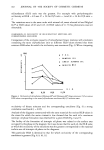
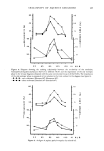
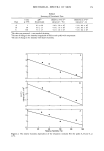
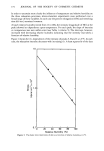
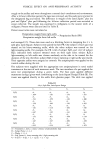
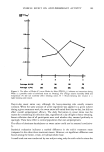
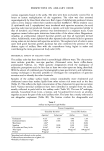
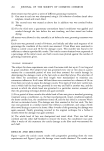
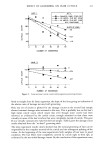
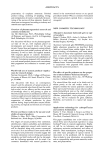
174 .JOURNAL OF THE SOCIETY OF COSMETIC CHEMISTS In order to ascertain more clearly the influence of temperature and relative humidity on the three relaxation processes, stress-relaxation experiments were performed over a broad range of these variables. In each case the percent elongation (0.6%) and stretching time (0.6 sec.) remained constant. At each relative humidity tested from 23 to 90%, the intensity (magnitude of H(r) at the peak) showed no dependence upon temperature. For each peak, the slope of intensity vs. temperature was zero within error (see Table 1 column 5). The intercept, however, increased with decreasing relative humidity indicating that the intensity was solely a function of relative humidity. Figure 2 shows the r.h. dependence of the intensity of peaks A, B and C at 21øC. In each case, the relaxation intensity decreases with increasing r.h. A least squares fit of the data 10 I i i I 0.1 • I • ] 0 20 40 60 80 1 O0 Relative Humidity (%) Figure 3. The elastic (zero-time) stress of skin as a function of relative humidity at 21øC.

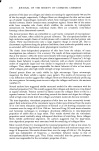
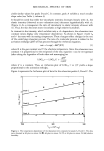
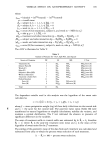
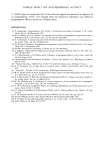
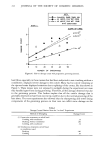
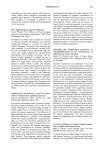
MECHANICAL SPECTRA OF SKIN 175 yields similar values for peaks B and C. In contrast, peak A exhibits a much smaller slope value (see Table 1, column 4). It should be noted that while the viscoelastic intensity decreases linearly with r.h., the elastic intensity (observed at zero relaxation time) decreases logarithmically with r.h. (Figure 3). As a consequence the ratio of viscoelastic to elastic intensity decreases with r.h. Thus, the skin becomes more viscoelastic at high relative humidities. In contrast to the intensity, which exhibits only a r.h. dependence, the relaxation time constant values display only temperature dependence. As shown in Figure 1 both •'B and •.c decrease with increasing temperature. These changes reflect changes in the rate of the underlying relaxation process. The rate of a molecular process is related to the activation enthalpy (AH*) of that process through the Arrhenius equation, rate = k exp(--AH*/RT) (2) where R is the gas constant and T the absolute temperature. Since the relaxation time constant r is proportional to the reciprocal of the rate, equation 1 can be re-expressed (after taking the logarithm of both sides and rearranging) as AH* LOG•0 r = LOG•0 k' + -- (3) 2.3RT where k' is a constant. Thus, an Arrhenius plot of LOG•0 ß vs 1/T yields a slope proportional to the activation enthalpy. Figure 4 represents the Arrhenius plot of data for the relaxation peaks A, B and C. The o Ioo Peak C Peak B • -- , , , J I i I 320 1/T x (105/OK) Figure 4. The temperature dependence of the relaxation time constants for peaks A, B and C. The data were obtained at 90 plus or minus 5% (0), 60 plus or minus 5% (O) or 40 plus or minus 5% (A) relative humidity. 34( Peak A ,,•,
Purchased for the exclusive use of nofirst nolast (unknown)
From: SCC Media Library & Resource Center (library.scconline.org)