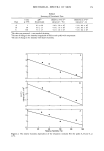
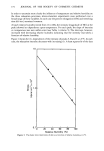
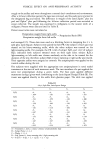
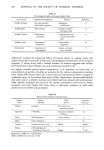
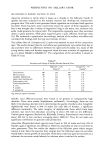
184 JOURNAL OF THE SOCIETY OF COSMETIC CHEMISTS manually. The lotion and hydroalcoholic solution were applied with tared cotton swabs. All antiperspirants were applied to the 2• x 4• inch delineated axillary area. This area is outlined by the hairy portion of the axillae where apocrine and eccrine sweating occur. A measured amount of test antiperspirant was applied daily to the treated axilla for a two-day period to accomodate the axilla to the antiperspirant no sweat was collected. On each of the next three days, antiperspirant was applied to the treated axilla. An elapsed one-minute drying time was allowed before taping the tared pads to the axilla. A tared pad also was taped snugly to the control axilla. The subjects proceeded with their daily routines. At the end of the 10-hour collection period, they removed the tape and sealed the pads in the designated bags. The pads and test antiperspirant containers were collected by the investigators to be weighed for daily sweat weights and amount of antiperspirant applied. Post-test sweat collection data for a sample subject pair are listed in Table IV. Table IV Post-test Sweat Collection Data Sample Day 1 Day 2 Day 3 Right Left Right Left Right Left Treatments* (mg) (mg) (mg) (mg) (mg) (mg) z** Subject B2D• A• 168.2 143.3 67.0 73.9 102.0 117.9 +O.OO6 A2 103.1 286.8 63.4 78.6 94.4 83.8 -- 0.543 A 3 125.2 195.6 204.4 771.6 64.1 59.5 -- 0.959 A 4 479.0 884.5 427.6 483.0 79.5 80.1 --0.384 Subject B2D2 A• 90.6 93.6 163.1 109.9 67.7 82.1 + 0.118 A 2 310.5 71.0 58.6 76.3 126.0 237.5 -- 0.252 A 3 100.0 27.2 380.0 136.7 102.1 94.9 --0.812 A 4 216.0 95.3 509.7 213.7 447.8 298.5 -- 0.658 *A•, stick A2, cream A 3, lotion A4, hydroalcoholic solution. **z = In (•/•) = In ([y• + Y2 + Y,I Ix, + x2 + x,]) Nine-day recovery periods, in which no sweat was collected nor antiperspirant applied, alternated with the four treatment weeks. 3. STATISTICAL TREATMENT OF RESULTS Post-test sweat collection data were evaluated statistically using the geometric mean of treatment results of a 4 x 4, split plot, Latin Square design (16, 17), illustrated in Table III. The letters D• and D 2 represent the heavy-sweating sides and light-sweating sides treated, respectively. The columns represent the four treatment weeks the rows represent subject pairs and the blocks indicate the treatments. The statistical model describing this treatment design is indicated in Table III. Zjkmp = •'• -}- •gj -}- •k -}- '•m '4- T•jk m '4- {•p -}- (•g•)jp -}- (•)kp -}- ('•)rnp -}- •jkmp

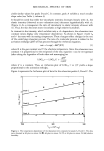
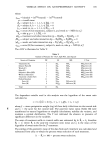
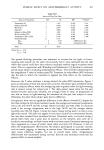
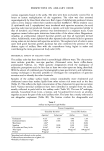
VEHICLE EFFECT ON ANTI-PERSPIRANT ACTIVITY 185 where Zjkmp = In(ratio) -- ln(Zmgtreated) - ln(Zmgcontrol) overall mean •k T•jkm bp •{•kp {•jkmp subject k, k = 1, 2, 3, 4 •3•k = 0 subject k, k = 1, 2, 3, 4 •3•k = 0 week m, m, = 1, 2, 3, 4 23'ym = 0 error (A) for treatment j, subject k, and week m • NID (0, tr, 2) side p, p = 1, 2 23•p = 0 treatment and sides interaction jp --• 23i(•b)i p = •3p(O/•)jp = 0 subject and sides interaction kp • •3k(•{•)k p = •3p(•{•)k p = 0 weeks and sides interaction mp • 23m('yt$)m p = •p(•/•)mp = 0 error (B) for treatment j, subject k, week m, side p • NID (0, tr, 2) The AOV is illustrated in Table V. Table V Analysis of Variance for 4 by 4, Split Plot, Latin Square Source of Variation DF SS MS F Test Treatments (A) 3 SS^ MS^ MS^/error (A) Subject Pairs (B) 3 SS. MS. MS./error (A) Weeks (C) 3 SSc MSc MSc/error (A) Sides (D) 1 SSD MSD MSD/error (B) Subjects x Sides (BD) 3 SS.on MS.on MS.on/error (B) Weeks x Sides (CD) 3 SScon MScon MScon/error (B) Treatment x Sides (AD) 3 SS^D MS^D MS^D/error (B) Pooled Residual 12 SSpR Error (A) 6 SSAB, MS error (A) Error (B) 6 SSAB D, MS error (B) Total 31 SS T The dependent variable used in this analysis was the logarithm of the sweat ratio calculated as z = In (•/•)= In ([y• + Y2 + Y3]/[x• + x2 + x3]) where • = mean perspiration weight (mg) of three daily collections on the treated side and • = the same for the control side. The post-test sweat ratios (Table III) were transformed to natural logarithms to simplify calculations, stabilize the variance, and maintain a normal distribution. The F test indicated the absence or presence of significant differences in the variables. The ratio of treat•rnent axilla to control axilla was estimated by In h i = •i, therefore R i = ej 2 where R i is the post-test treatment ratio mean and ii is the mean of the logarithm of sweat ratios for the jth treatment. The antilog of the geometric mean of the data from each treatment was calculated and subtracted from unity to obtain the percent sweat reduction of each treatment. (1 -- hi) X 100 = percent sweat reduction.
Purchased for the exclusive use of nofirst nolast (unknown)
From: SCC Media Library & Resource Center (library.scconline.org)