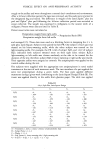
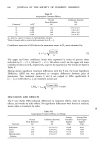
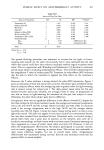
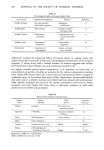
186 JOURNAL OF THE SOCIETY OF COSMETIC CHEMISTS Table VI Antiperspirant Treatment Efficacy Percent Confidence Intervals, Sweat Reduction 95%, Treatment a In •,•b (%) (%) A• 0.060 -6.2 -37.3 to 17.9 A 2 --0.382 31.8 11.8 to 47.2 A• --0.478 38.0 19.8 to 52.0 h 4 --0.391 32.4 12.5 to 47.7 aA•, stick h2, cream A3, lotion h4, hydroalcoholic solution. bRatio of treated axilla to control axilla estimated by In R• = E•. Confidence intervals of 95% about the t.reatment mean, In •j, were estimated by .•/error (A) •j + t6,.o 5 • • The upper and lower confidence limits were expressed in terms of percent sweat reduction by (1 - e u) x• 100 and (1 - e l) x 100 where u and 1 are the upper and lower confidence limits on In R i, respectively, as given by equation [1]. The results are listed in Table V. Having shown significant treatment differences with the F test, the Least Significant Difference (LSD) test was performed to compare differences between pairs of treatments. Two treatment means, •i and •i are judged to differ significantly if ]•i - •i[ LSD where zi, z i are treatment means and 2 (error (A)) _ 0.364 LSD95 = t6"ø5 8 - DISCUSSION AND RESULTS The F test (Table VIII) indicated differences in treatment effects, sides by subjects effects, and weeks by sides effects. No significant differences were found in subjects, weeks, sides or treatment by sides. Table VII Antiperspirant Treatment Efficacy and Dosage Treatment Average Average Dose Percent Confidence Intervals, Treatment Active Agent Sweat Reduction 95% Applied Applied (%) (%) (mg) (mg) Solid Stock Cream Lotion Hydroalcoholic Solution -6.2 - 37.3 to 17.9 143.04 69.16 31.8 11.8 to 47.2 379.96 75.99 38.0 19.8 to 52.0 172.76 34.55 32.4 12.5 to 47.7 263.52 52.70

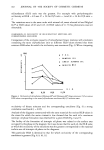
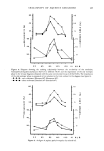
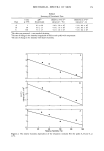
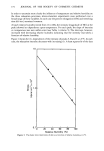
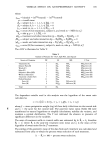
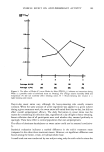
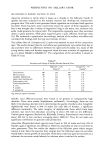
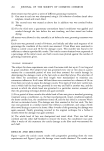
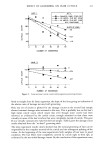
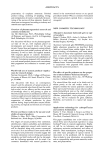
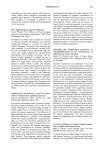
VEHICLE EFFECT ON ANTI-PERSPIRANT ACTIVITY 187 Table VIII Anova of Post-Test Data Source of Variations DF SS MS F Value* Treatments (A) 3 1.411 0.470 5.311 Subject Pairs (B) 3 0.659 0.220 2.486 Weeks (C) 3 0.079 0.026 0.294 Sides (D) 1 0.004 0.004 0.125 Subjects x Sides (BD) 3 1.002 0.334 10.438 Weeks x Sides (CD) 3 0.616 0.205 6.406 Treatments x Sides (AD) 3 0.145 0.048 1.500 Pooled Residual 12 0.721 0.060 SS^B. 6 0.531 0.0885 (error (A)) SSAm), 6 .190 0.0320 (error (B)) Total 31 4.637 *where F3,6, o5 = 4.76 F•,6,.o 5 = 5.99 The pretest blocking procedure was instituted to account for the light- or heavy- sweating side treated, yet the sides' (d) extremely low F value indicated that the side which was treated could have been selected randomly without regard to pretest sweat ratios. This is in agreement with Wooding and Finklestein's (14) decision to eliminate pretest sweat ratios in evaluating antiperspirant efficacy. This is further substantiated by the insignificant F value of subject pairs (B). Treatment by sides effects (AD) indicates that the side to which the treatment is applied has little effect on the treatment's efficacy. However, the F value indicates a strong subjects by sides (BD) interaction. Figure 1 gives an indication of how this interaction occurred. All subject pairs exhibited similar sides by subjects effects, where the average log ratio is greater when the light-sweating side is treated, except for subject pair 3. The daily pretest sweat ratios for this pair showed extreme day-to-day variation, but averaged close to unity, so designation of one side as heavy or light-sweating for members of this pair was subject to error. Otherwise, the other three subject pairs had no difference. As expected, there was no significant difference in the effects of weeks (C), despite the fact that during the first three treatment weeks, the average environmental temperature was in the low 60'søF and the average relative humidity was 40%, while in treatment week 4, the average temperature was in the high 70'søF and the average relative humidity was 70% (18). Figure 2 shows the major change during week 3 in heavy versus light-side treated. This does not appear to have been caused by environmental factors, but may have resulted from emotional factors. Treatment week 3 occurred during a period when there was a great deal of pressure on the subjects, who were all in academic surroundings, to finish course work and write exams. Emotional sweating has been suggested as a cause of erratic sweat ratios and rates (19). However, it did not affect the antiperspirants' effectiveness. All subjects participated in muscular exercise, such as tennis, jogging, or dancing, at various times. This activity was noticeable in daily sweat collection weights, but not in overall sweat ratios. Antiperspirant effectiveness was maintained during exercise. Exercise and emotional stress had the greatest effect on sweat weights.
Purchased for the exclusive use of nofirst nolast (unknown)
From: SCC Media Library & Resource Center (library.scconline.org)