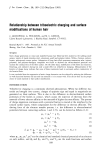
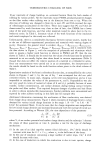
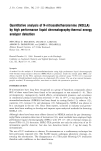
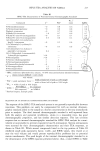
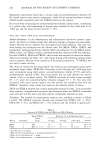
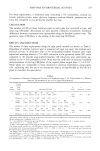
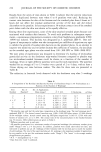
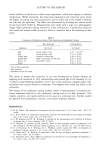
HPLC-TEA ANALYSIS OF NDELA 217 Table III HPLC-TEA Characteristics of Potential Internal Chromatographic Standards • W0.1 d Compound k' •' PAD (min) N-Nitrosodibutylamine --0 0.8 0.6 --0 0.8 0.8 N-Nitrosodiisopropylamine Diphenyl nitrosamine •0 0.7 0.8 N-Methyl-N-nit rosourea 1.0 0.7 0.6 N-Ethyl-N'-nitro-N-nitrosoguanidine •0 0.7 0.7 N-B utyl-N'-nitro-N-nitrosoguanidine 0.5 0.6 0.4 1-[2-Chloroethyl-3-(4-methylcyclo- hexyl)]- 1-nitrosourea •0 0.5 0.6 1-(2-Chloroethyl)- 3-cyclohexyl- 1- nitrosourea •0 0.5 0.6 1-(2-Chloroethyl)-3-(2,6-dioxo-3- piperidyl)- 1-nitrosourea 0.4 -- -- 2-[3-(2-Chloroethyl- 3-nitrosoureido)]- 2-deoxy-D-glucopyranose 10 -- -- N-Nitrosoproline 10 -- -- N-Nitroso-3-hydroxypiperidine f f f N-Nitrosodiisopropanolamine f f f p-Toluenesulfonylmethylnitrosamide --0 -- -- N-Nitrosopyrrolidone 3.2 3.8 2.2 N-Nitrosopyrrolidine 0.8 1.2 0.6 • 1.1 I 0.7 HPLC conditions: Spherisorb silica column, 75/19/6 isooctane/methylene chloride/methanol. elution volume NDELA--void volume k' = void volume width of back half of peak at 10% height PAF = peak asymmetry factor = width of front half of peak at 10% height W0 '• = width of peak at 10% height. PH NDELA wt compound RWR = X PH compound wt NDELA Standard impure multiple peaks. SELECTION OF AN INTERNAL CHROMATOGRAPHiC STANDARD The response of the HPLC-TEA analytical system is not generally reproducible between injections. This problem can easily be compensated for with an internal chromato- graphic standard added to the sample at a known concentration in the step immediately prior to analysis. The ideal internal chromatographic standard is well-separated from both the analyte and potential interferents, elutes in a reasonable time, has good chromatographic properties, and has similar detection response. This last criterion requires that an internal chromatographic standard for HPLC-TEA analysis be a semi- volatile or nonvolatile (to prevent evaporative loss) N-nitrosamine. Sixteen nitrosamines were screened for their chromatographic characteristics and their TEA responses, as shown in Table III. While several compounds listed in the top portion of Table III exhibited small peak asymmetry factor, width, and RWR values, they eluted at or near the void volume and would present reproducibility problems due to potential matrix interferences. The peak height of the internal chromatographic standard is in the denominator of the RWR equation presented above thus, a small RWR in Table

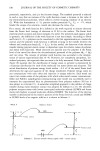
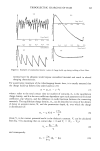
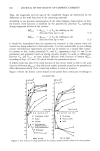
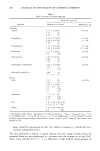
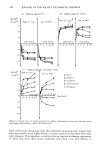
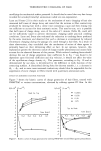
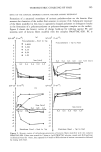
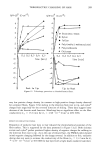
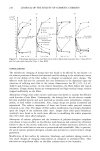
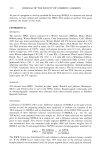
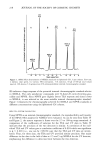
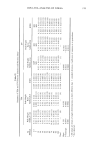
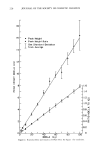
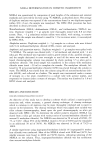
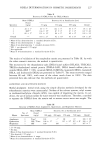
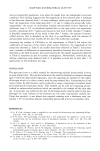
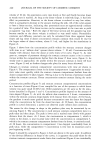
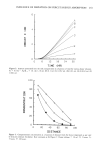
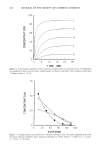
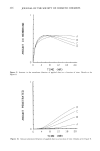
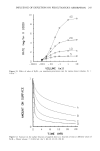
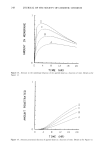
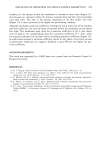
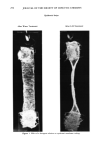
218 JOURNAL OF THE SOCIETY OF COSMETIC CHEMISTS I½S 5no NDELA 2.5ng 15 I0 ICS B 5nõ NDELA 5ng c ICS 5ng NDELA long 5 0 15 I0 5 0 15 I0 5 0 TIME (MINUTES) Figure 1. HPLC-TEA determination of NDELA standards on Spherisorb CN, 5 •tm column. Flow rate, 2 ml/min chart speed, 0.2 in/min TEA attenuation, X 8 injection, 50 •tl of 500 •tl total volume injected. ICS denotes 5.0 ng/injection of N-nitrosopyrrolidine internal chromatographic standard. III indicates a large response of the potential internal chromatographic standard relative to NDELA. The only satisfactory compounds were N-butyl-N'-nitro-N-nitroso-gua- nidine and NPYR. Since NPYR gave slightly better TEA response and eluted closer to NDELA, it was selected as the more suitable internal chromatographic standard. Figure 1 illustrates the chromatography achieved for NDELA and NPYR standards at different concentrations using the Spherisorb CN column. HPLC-TEA SYSTEM VALIDATION Using NPYR as an internal chromatographic standard, the reproducibility and linearity of the HPLC-TEA analysis for NDELA were evaluated. As can be seen from Table IV and Figure 2, the system response is linear over the 2.5 to 100-ng range examined. A comparison of the coefficients of variation for the TEA and UV data in Table IV indicates that the precision of the two detectors is similar. A correlation of the indi- vidual TEA and UV values gave a correlation coefficient of 0.994 which was significant to p 0.001 (i.e., one can be 99.9% sure that the TEA and UV data are interre- lated). Thus, for these data, the TEA and UV provided similar precision. One major difference in the data is the lack of data at 2.5 and 5 ng NDELA for the UV detector, emphasizing the difference in detection limit between the two detectors.
Purchased for the exclusive use of nofirst nolast (unknown)
From: SCC Media Library & Resource Center (library.scconline.org)