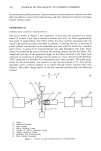
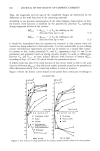
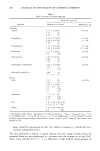
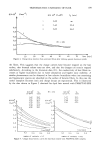
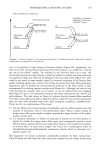
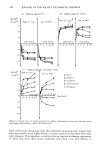
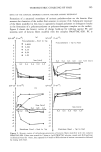
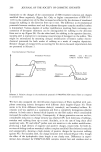
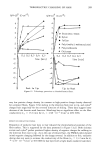
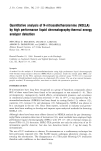
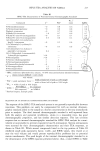
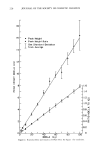
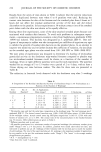
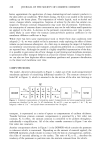
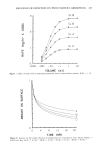
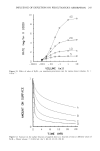
INFLUENCE OF DEPLETION ON PERCUTANEOUS ABSORPTION 239 In the model, the viable epidermis and dermis are combined into a single compartment labeled AQ. From AQ, passage takes place into a SINK, intended to represent the blood. The volume of the donor compartment can be changed at will. By varying the donor volume while the other parameter values are kept constant, we are in effect assuming that compositional changes within the donor due to evaporation, solvent sorption, and other factors do not take place after application. At this stage of model development, solvent transport through the skin and its possible effect on permeant transfer are not considered. We also neglect differences in stratum corneum hydration that may be dependent on donor volume, particularly if the vehicle is aqueous. Finally, the model shown in Figure 1 contains only a single permeation pathway, so that simultaneous transport through shunt pathways is ignored. Notwithstanding these restrictions, it is possible to get useful information on permeant depletion and on the consequences of depletion with regard to skin transport from the simulations. The symbol M is used to represent the amount of permeant in a compartment, while compartment volume is represented by V. Compartments are identified by subscripts the stratum corneum compartments are numbered from 1 to 5, starting at the donor side. The donor compartment is represented by D, the AQ compartment by A, and the sink by S. All of the stratum corneum compartments have the same volume, denoted as V•. The following equations describe the rate of change of the amount of permeant in each compartment: dMD/dt = K_•M• -- KiMDV1/V D (1) dM•/dt = K•MDV•/VD + K(M2 -- M1) - K_•M1 (2) dM/dt = K(M i_1+ Mi+I - 2Mi) where j = 2,3,4 (3) dMs/dt = KM4 + K_^M^V1/V^- (K + K^)M 5 (4) dM^/dt = K^M 5 - (K_^V1/V^ + Ks)M^ (5) dMs/dt = KsM^ (6) K^ and K_^ were assigned a value of 1 hr-land Ks a value of 2 hr-1. Initial donor concentration was 10 mg/ml, cross sectional area was 1 cm -2, and stratum corneum thickness was 0.001 cm in all cases. The values of K and of K•/K_• were varied to represent different transport properties and partition coefficients, respectively. The equations were solved numerically and the results tabulated as a function of time. K was chosen to be smaller than the other rate constants so that transport through the stratum corneum compartments would control the overall transport rate, a situation commonly encountered in practice. Relatively large changes in the values of K_^ and Ks had only a minor effect on the amount penetrated or the concentration gradient within the stratum corneum. RESULTS AND DISCUSSION Figure 2 contains plots of the amount penetrated as a function of time for different donor volumes. For these simulations, K = 0.6 hr- • and K•/K_• = 10. With a donor

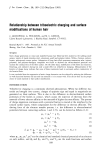
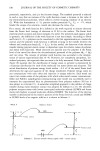
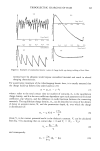
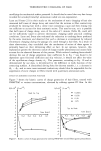
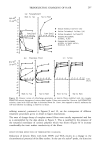
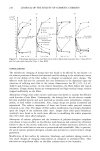
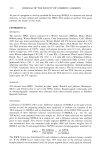
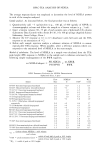
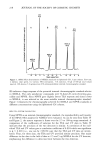
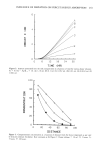
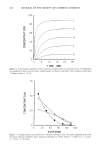
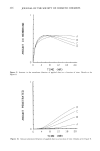
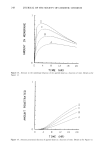
240 JOURNAL OF THE SOCIETY OF COSMETIC CHEMISTS volume of 10 ml, the penetration curve rises slowly at first and finally becomes linear as steady state is reached. As long as the donor volume is relatively large, it has little effect on penetration. However, as the donor volume is reduced to very low values, there is a progressive decrease in the amount reaching the sink. All of the curves appear to have a linear section, indicating that penetration rates are approximately constant for a period of time. This linear section can be extrapolated to the time axis to yield an apparent "lag time." Both the slope of the linear section and the apparent lag time become smaller as the donor volume is reduced to very small values. Permeability constants and diffusion constants can only be calculated from these apparent linear slopes and lag times if donor concentration remains constant (this would be true for the larger values of donor volume, about 0.1 ml, and higher for the simulations in Figure 2). Figure 3 shows how the concentration profile within the stratum corneum changes with time in an "infinite dose" system (donor volume = 10 ml). Concentration falls sharply with distance from the donor at early times (2 hr curve, Figure 3). As time goes on, transport of permeant through the stratum corneum causes a rise in concen- tration within the compartments further from the donor (5 hour curve, Figure 3). As steady state is approached, the profile within the stratum corneum is linear (20 hour curve, Figure 3) and no further changes take place for many hours afterward. Changes in stratum corneum compartment concentrations with time are shown in Figure 4. The compartment closest to the donor (compartment 1) approaches its steady- state value most quickly while the stratum corneum compartment furthest from the donor (compartment 5) takes longest. The lag is due to the kinetics ofpermeant transfer within the stratum corneum. Donor concentration remains constant during the entire period. Concentration profiles (Figure 5) and stratum corneum compartmental concentrations as a function of time (Figure 6) are compiled for one of the systems in which donor volume was quite small (0.0032 ml). Other parameters are the same as for the simu- lation described in Figures 3 and 4. Concentration profiles depend on the amount of time elapsed (Figure 5). As with the infinite dose situation at 2 hours, concentration within the stratum corneum drops sharply with distance from the donor. At five hours, the gradient is much more gradual because concentration near the donor has dropped while the concentration far from the donor has risen. At 20 hours, the concentration profile is curved downward, a pattern not observed under infinite dose conditions. The reason for this change in shape in the gradient plots may be ascertained by ex- amining Figure 6. The concentration in each stratum corneum compartment rises to a peak value and then drops. The peak is lower and is reached more slowly with greater distance from the donor. At 2 hours, the concentration in compartment 1, which is closest to the donor, is near its peak value while the concentration in compartment 5, which is the stratum corneum compartment farthest from the donor, is extremely small. At 20 hours, the concentration in compartment 1 has dropped considerably from its peak value, while the compartment 5 concentration is very near its maximum and is just beginning to fall. Figure 6 should be compared to Figure 4 both are drawn to the same scale. In addition to the obvious differences in shape of the curves, it is apparent that peak values for the stratum corneum compartments under finite dose conditions (Figure 6) are considerably
Purchased for the exclusive use of nofirst nolast (unknown)
From: SCC Media Library & Resource Center (library.scconline.org)