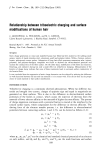
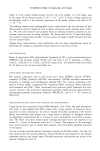
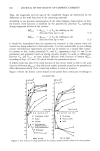
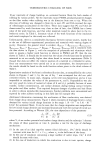
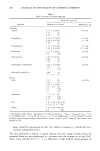
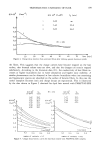
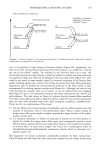
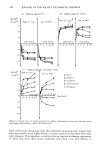
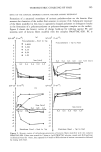
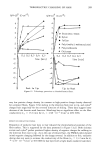
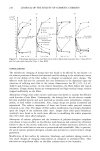
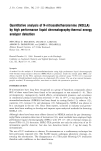
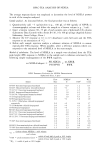
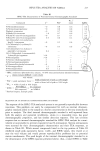
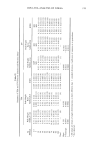
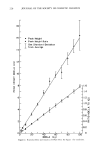
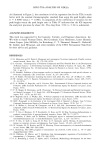
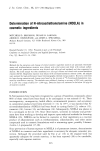
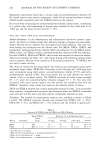
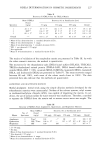
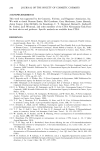
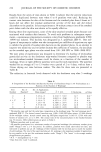
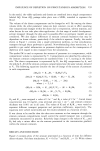
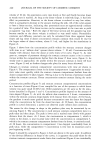
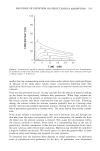
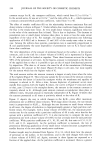
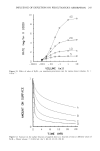
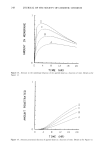
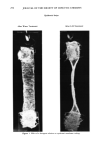
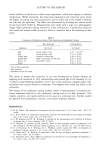
218 JOURNAL OF THE SOCIETY OF COSMETIC CHEMISTS I½S 5no NDELA 2.5ng 15 I0 ICS B 5nõ NDELA 5ng c ICS 5ng NDELA long 5 0 15 I0 5 0 15 I0 5 0 TIME (MINUTES) Figure 1. HPLC-TEA determination of NDELA standards on Spherisorb CN, 5 •tm column. Flow rate, 2 ml/min chart speed, 0.2 in/min TEA attenuation, X 8 injection, 50 •tl of 500 •tl total volume injected. ICS denotes 5.0 ng/injection of N-nitrosopyrrolidine internal chromatographic standard. III indicates a large response of the potential internal chromatographic standard relative to NDELA. The only satisfactory compounds were N-butyl-N'-nitro-N-nitroso-gua- nidine and NPYR. Since NPYR gave slightly better TEA response and eluted closer to NDELA, it was selected as the more suitable internal chromatographic standard. Figure 1 illustrates the chromatography achieved for NDELA and NPYR standards at different concentrations using the Spherisorb CN column. HPLC-TEA SYSTEM VALIDATION Using NPYR as an internal chromatographic standard, the reproducibility and linearity of the HPLC-TEA analysis for NDELA were evaluated. As can be seen from Table IV and Figure 2, the system response is linear over the 2.5 to 100-ng range examined. A comparison of the coefficients of variation for the TEA and UV data in Table IV indicates that the precision of the two detectors is similar. A correlation of the indi- vidual TEA and UV values gave a correlation coefficient of 0.994 which was significant to p 0.001 (i.e., one can be 99.9% sure that the TEA and UV data are interre- lated). Thus, for these data, the TEA and UV provided similar precision. One major difference in the data is the lack of data at 2.5 and 5 ng NDELA for the UV detector, emphasizing the difference in detection limit between the two detectors.

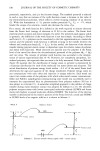
HPLC-TEA ANALYSIS OF NDELA 219 • z zz o o•
Purchased for the exclusive use of nofirst nolast (unknown)
From: SCC Media Library & Resource Center (library.scconline.org)