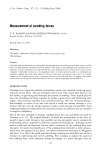
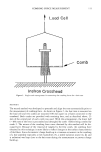
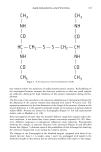
192 JOURNAL OF THE SOCIETY OF COSMETIC CHEMISTS acid distribution in the cutaneous tissue of hairless rats, in vivo, after single and repeti- tive applications. MATERIALS AND METHODS ANIMALS Hairless Sprague Dawley male rats, IOPS (IFFA CREDO), weighing from 300 to 350 g, were used. The animals, provided with A03 food (UAR), were kept at 22øC with light provided for 12-h periods. PREPARATION OF THE LINOLEIC ACID EMULSION An isotopic dilution in toluene of 1-14C labeled linoleic acid (56 mCi/mM, Amersham France) was performed with vitamin F • containing 53% of linoleic acid. The radio- chemical purity of the labeled compound, checked before use by thin layer chromatog- raphy, was greater than 98%. An oil/water emulsion (Nutribel ©, Lanc6me) containing 2% (w/w) of the labeled vitamin F was prepared so its final radioactive concentration reached 125 IxCi/g. DISTRIBUTION OF 14C LINOLEIC ACID UNDER THE APPLICATION AREA Single application procedure. 100 mg of emulsion were spread upon 2.54 cm 2 of the dorsal skin of the animal and allowed to remain for 2, 6, or 24 h. To prevent contamination by self-licking or scratching, a metallic protection device was fixed above the applica- tion area, on the animal which was previously anesthetized by an IP injection of Nem- butal (30 mg/kg). Six rats were used for each time of application. Iterative applications procedure. Fifty mg of emulsion were applied on six rats according to the single application procedure. The applications were repeated daily for six days with no product rinse off or wipe off between applications. After the last treatment, the animals were divided into two groups kept respectively for 24 h and 72 h longer before sacrifice. Distribution studies. After each defined period, the rats were sacrificed by decapitation and the treated skin was cut off. The excess emulsion was wiped off, taking care not to spread it out of the application area. The underlying stratum corneum was removed by twenty strippings with adhesive tape. Three biopsies (0.3 cm 2) were punched out from the frozen skin and fixed on a freeze microtome (Cryo-cut, American Optical). Using the method previously described by Schaefer and Stuttgen (14), tissue slices of 20-lxm thickness or 40-lxm thickness when the dermis was reached were cut parallel to the cutaneous surface. The strips and slices were each placed in counting vials filled with 15 ml of toluene scintillator (Packard) and shaken for 12 h to extract radioactive material which was assayed in a liquid scintilla- tion counter (Packard Tricarb 3330). Essential fatty acids mixture.

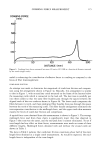
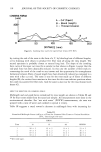
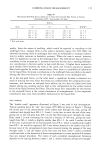
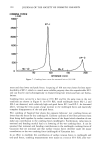
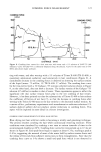
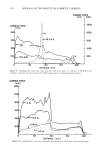
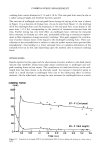
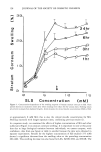
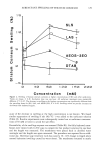
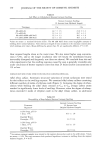
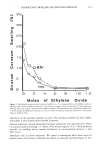
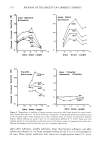
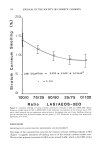
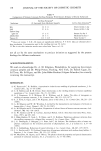
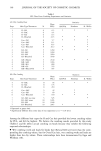
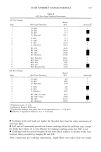
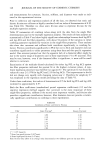
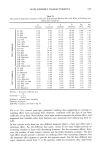
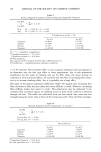
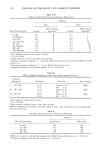
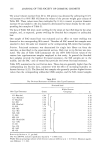
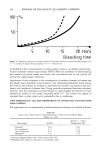
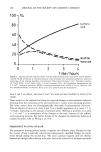
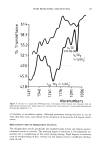
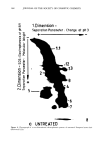
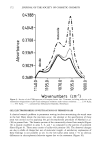
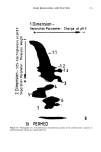
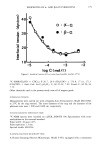
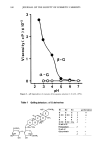
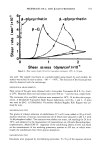
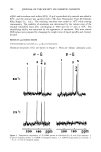
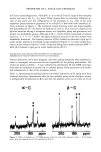
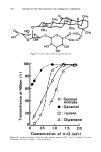
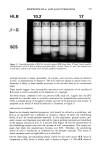
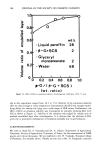
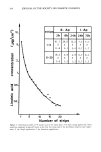
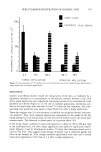
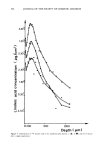
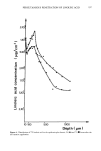
PERCUTANEOUS PENETRATION OF LINOLEIC ACID 193 TREATMENT OF RESULTS Specific quenching curves were established for the scintillation mixture. From counting rates of suitably diluted standards, •4C values expressed in d.p.m. were converted to equivalent linoleic acid quantities corresponding to this acid and its metabolites. In order to obtain concentration profiles of linoleic acid in the skin, the concentrations of drug were calculated using a Tektronic 4052 computer. They were expressed as I•g per cm 2 of application area in the horny layer and as I•g per cm 2 of application area per cm of single slice thickness, i.e., •g/cm 3 in the epidermis and the dermis. The results were expressed as their means and standard deviations (SEM). Statistical analyses were performed using the non-parametric Mann Whitney U test (15). Results obtained from the single application experiments were compared between treatment durations of 2 and 6 h, 6 and 24 h, and 2 and 24 h. RESULTS DISTRIBUTION OF LINOLEIC ACID IN THE HORNY LAYER The concentration profile of linoleic acid in the horny layer 24 h after a single applica- tion is shown in Figure 1. Concentration profiles corresponding to other cases are not shown since the trends of the curves are all identical. Twenty-four and seventy-two h after the last iterative application, radioactivity was less concentrated in the first five strips than after single application (2 and 6 h), and so the concentration gradients of linoleic acid decreased respectively by one order to two orders of magnitude from the surface of the skin to the deeper part of the stratum corneum. As shown in Figure 2, the duration of the single application step had a marked effect on the linoleic acid content of the stratum corneum which decreased significantly (p • 0.05) from 79.9 - 13.6 •g/cm 2 (2 h) to 32.7 + 5.9 •g/cm • (6 h) to 17.1 + 1.3 I•g/cm 2 (24 h). Total amounts recovered following iterative applications stayed un- changed: 14.2 _ 1 •g/cm 2 (24 h) and 13.7 + 3 I•g/cm 2 (72 h after the last applica- tion). DISTRIBUTION OF LINOLEIC ACID IN THE EPIDERMIS AND DERMIS As shown in Figures 3 and 4, linoleic acid distribution profiles in the epidermis and dermis were qualitatively similar for each experiment. A concentration maximum is observed between 150 and 200 I•m of tissue depth followed by a rapid decrease of radioactivity deeper in the dermis. The total quantities of linoleic acid recovered from the epidermis and dermis (Figure 2) increased significantly (p • 0.05) between 2 and 24 hours after a single application from 16.4 + 1.3 •g/cm 2 (2 h) to 29.2 + 1.6 •g/cm l (6 h) to 77.4 + 2.8 •g/cm • (24 h). In the case of multiple applications, the total quantities of linoleic acid were signifi- cantly higher (p • 0.05) in rats killed 24 h after the last treatment (54.9 + 2.9 •g/cm l) than in rats kept 48 hours longer (31.3 + 6.2 •g/cm•).
Purchased for the exclusive use of nofirst nolast (unknown)
From: SCC Media Library & Resource Center (library.scconline.org)