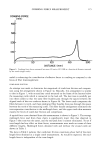
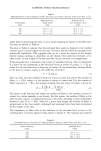
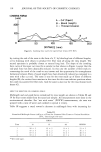
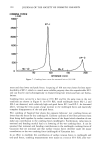
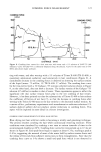
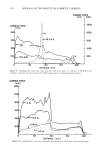
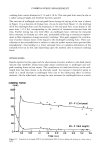
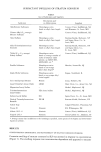
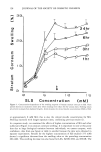
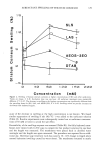
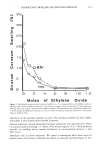
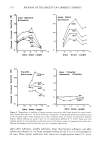
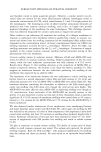
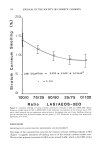
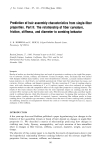
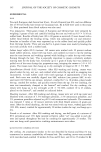
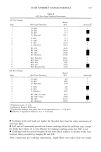
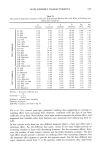
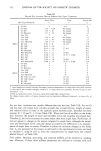
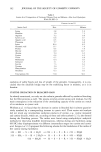
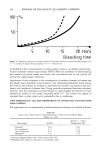
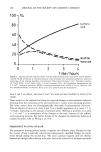
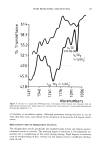
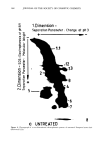
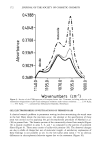
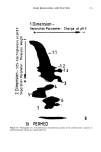
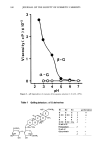
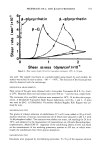
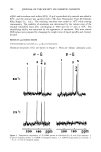
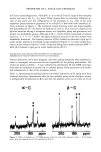
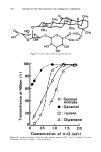
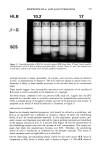
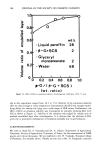
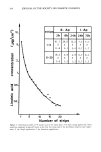
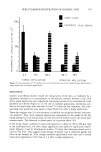
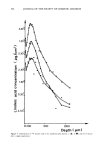
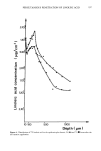
PERCUTANEOUS PENETRATION OF LINOLEIC ACID 193 TREATMENT OF RESULTS Specific quenching curves were established for the scintillation mixture. From counting rates of suitably diluted standards, •4C values expressed in d.p.m. were converted to equivalent linoleic acid quantities corresponding to this acid and its metabolites. In order to obtain concentration profiles of linoleic acid in the skin, the concentrations of drug were calculated using a Tektronic 4052 computer. They were expressed as I•g per cm 2 of application area in the horny layer and as I•g per cm 2 of application area per cm of single slice thickness, i.e., •g/cm 3 in the epidermis and the dermis. The results were expressed as their means and standard deviations (SEM). Statistical analyses were performed using the non-parametric Mann Whitney U test (15). Results obtained from the single application experiments were compared between treatment durations of 2 and 6 h, 6 and 24 h, and 2 and 24 h. RESULTS DISTRIBUTION OF LINOLEIC ACID IN THE HORNY LAYER The concentration profile of linoleic acid in the horny layer 24 h after a single applica- tion is shown in Figure 1. Concentration profiles corresponding to other cases are not shown since the trends of the curves are all identical. Twenty-four and seventy-two h after the last iterative application, radioactivity was less concentrated in the first five strips than after single application (2 and 6 h), and so the concentration gradients of linoleic acid decreased respectively by one order to two orders of magnitude from the surface of the skin to the deeper part of the stratum corneum. As shown in Figure 2, the duration of the single application step had a marked effect on the linoleic acid content of the stratum corneum which decreased significantly (p • 0.05) from 79.9 - 13.6 •g/cm 2 (2 h) to 32.7 + 5.9 •g/cm • (6 h) to 17.1 + 1.3 I•g/cm 2 (24 h). Total amounts recovered following iterative applications stayed un- changed: 14.2 _ 1 •g/cm 2 (24 h) and 13.7 + 3 I•g/cm 2 (72 h after the last applica- tion). DISTRIBUTION OF LINOLEIC ACID IN THE EPIDERMIS AND DERMIS As shown in Figures 3 and 4, linoleic acid distribution profiles in the epidermis and dermis were qualitatively similar for each experiment. A concentration maximum is observed between 150 and 200 I•m of tissue depth followed by a rapid decrease of radioactivity deeper in the dermis. The total quantities of linoleic acid recovered from the epidermis and dermis (Figure 2) increased significantly (p • 0.05) between 2 and 24 hours after a single application from 16.4 + 1.3 •g/cm 2 (2 h) to 29.2 + 1.6 •g/cm l (6 h) to 77.4 + 2.8 •g/cm • (24 h). In the case of multiple applications, the total quantities of linoleic acid were signifi- cantly higher (p • 0.05) in rats killed 24 h after the last treatment (54.9 + 2.9 •g/cm l) than in rats kept 48 hours longer (31.3 + 6.2 •g/cm•).

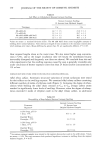
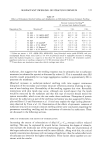
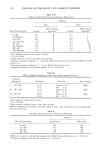
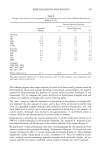
194 JOURNAL OF THE SOCIETY OF COSMETIC CHEMISTS s. Ap I.Ap strips 2h 6h 24h 24h 72h 61.7 26.8 12.2 7.5 7.5 1-5 + + + + + 11.8 5.1 3.4 0.7 1.7 18.2 5.9 4.9 6.7 6.2 6-20 + + + + + 3,6 1,3 ],2 0,7 ].3 lb 1'5 2'0 Number of strips Figure 1. Distribution profile of •4C linoleic acid in the horny layer, 24 h after a single application. Total quantities expressed as }xg/cm 2 found in the first five strips and in the last fifteen strips for each experi- ment. S. Ap: Single application I. Ap: Interative applications.
Purchased for the exclusive use of nofirst nolast (unknown)
From: SCC Media Library & Resource Center (library.scconline.org)