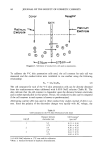
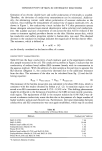
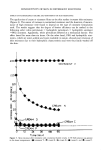
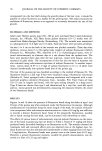
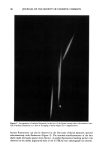
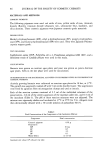
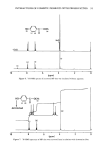
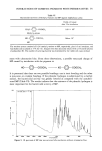
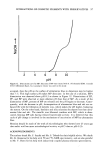
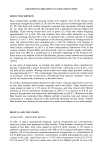
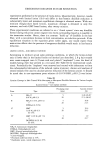
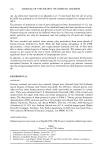
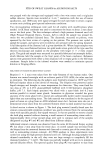
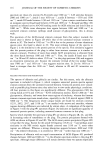
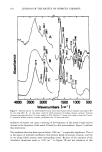
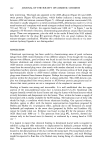
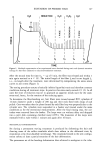
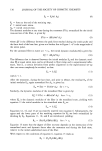
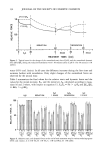
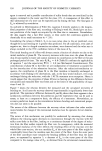
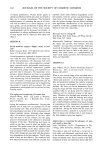
FTIR OF SWEAT GLANDS & ALUMINUM SALTS 113 from the axilla and the forearm. Biopsies were stored under liquid nitrogen until ready for use. Stratum corneum was peeled from the epidermis under water, prehydrated in 0.1 N NaCI, soaked in 20% ACH, rinsed in 0.1 N NaC1, and in most cases placed on grids and allowed to dry. The stratum corneum samples (-- 1-2 mm 2) were soaked in 1 mL of 20% ACH with occasional shaking for 1 to 2.5 hours. The rinses (0.1 N NaC1) involved at least one transfer to a fresh solution, also with occasional shaking, for a total rinse time of 2 or 3 hours. One or two pieces of stratum corneum comprised each sample. RESULTS AND DISCUSSION IN VIVO PLUG # 1 Absorbance spectra obtained from forearm biopsies from one subject are shown in Figure 2. Spectrum 2A was obtained from the dark plug area. Two basic features of this A I i I I /, 35OO 3000 1500 1000 Wavenumbers {cu '1 } Figure 2. Infrared spectra of human forearm biopsies from subject #1: A, ACH-inhibited sweat ducts (dark "plug" areas in Figure 1). B, ACH-treated stratum comeurn near plug #1. C, untreated stratum corneum in ductal area.

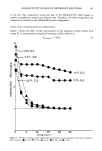
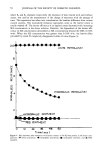
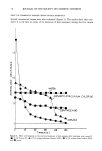
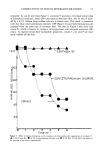
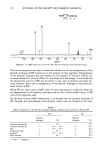
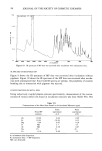
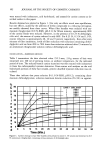
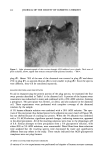
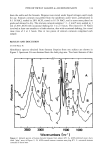
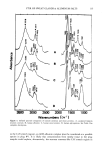
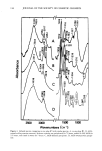
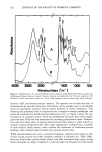
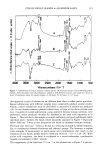
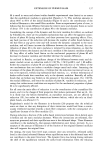
114 JOURNAL OF THE SOCIETY OF COSMETIC CHEMISTS spectrum are those of a protein (N-H stretch near 3300 cm-•, C-H stretches between 2800 and 3000 cm-•, amide I near 1650 cm-•, amide II between -1550 and 1500 cm-•, amide III bands between 1230 and 1265 cm-•) plus a major contribution from an inorganic species (broad band between 1070 and 1090 cm-•). Reisgraf and May (10) reported an infrared active AI-O-H bending mode for ACH solutions and dried films at 1080 cm -•. While some absorption does appear between 1060 and 1080 cm -• in untreated stratum corneum (perhaps small amount of glycoprotein), this is always weak. The spectrum of the ACH-treated stratum corneum from this subject (outside the ductal area) is shown in Figure 2B while that of the untreated stratum corneum is shown in 2C. The band at 1042 cm-• in 2B is due to the presence of some aluminum species since this band is absent in 2C. The most striking feature of the spectra in Figure 2 is the similarity in the protein portion of the spectra. This similarity suggests that the protein portion of the plug is either from stratum corneum or is similar to stratum corneum. Evidence of more than simple ACH precipitation is obtained from the three bands between 1600 and 1400 cm -•. First, the amide II band near 1530 cm-• in 2B and 2C shifts to about 1520 cm-• in the plug spectrum (2A) and suggests an Al-protein interaction site. Second, the intensity reversal of the two weaker bands near 1400 cm-• and 1450 cm -• also suggests reaction sites. In 2A the 1450 cm -• band is stronger than the 1400 cm -• band, whereas in 2B and 2C intensities are reversed. RELATED PROTEINS AND PRECIPITATES The spectra of albumin and globulin are similar. For this reason, only the albumin spectrum is included in Figure 3, which compares unreacted protein spectra against stratum corneum from the untreated (control) forearm. Unreacted proteins were consid- ered as possible plug formers since they salted out in vitro under physiologic conditions. All four proteins in this figure are significantly different. The glycoprotein (3D) has strong bands at 1072 and 1104 cm-• (O-H deformation modes). Above 1200 cm-• the glycoprotein, albumin, and sweat show some regions of similarity, whereas the forearm stratum corneum spectrum stands alone, especially in the C-H stretch region (2800 to 3000 cm-•). The frequencies where unique bands are found for stratum corneum (1235, 2852, 2917, and 3318 cm -•) are marked with arrows and asterisks, whereas regions showing differences are indicated by arrows alone. A comparison of the spectra in Figure 3 with the plug # 1 spectrum (Figure 2A) indicates no significant quantity of unreacted protein species, including unreacted stratum corneum in this plug. Spectra which resemble the spectrum of plug # 1 are shown in Figures 4B, 4C, and 4D, in decreasing order of resemblance to the plug. The protein precipitates formed with ACH are shown in Figures 4C and 4D. The ACH-sweat protein precipitate (Figure 4D) is least like the plug. Except for the amide II frequency (1520 cm-•) and perhaps some similarity in the NH stretch region (bands centered near 3330 cm-•), most other regions are different. Whereas a strong absorption appears between 1000 and 1100 cm-• (Al-related vibrations), it is centered at 1057 cm-• rather than near 1080 cm-•. Precipitation of albumin with an equal concentration of ACH (Figure 4C) produced changes between 1400 and 1600 cm-• in the albumin spectrum similar to the plug # 1 spectrum. Although major differences still remain between these two spectra (especially
Purchased for the exclusive use of nofirst nolast (unknown)
From: SCC Media Library & Resource Center (library.scconline.org)