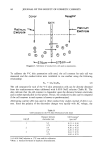
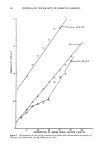
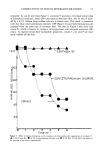
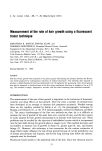
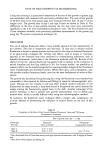
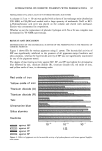
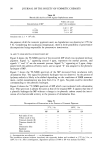
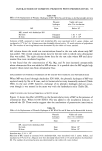
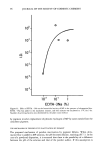
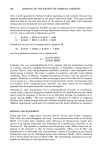
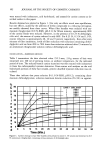
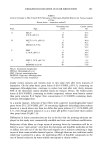
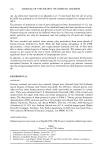
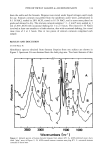
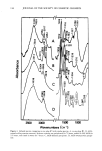
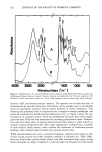
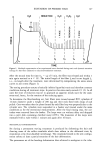
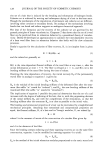
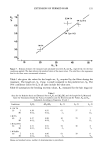
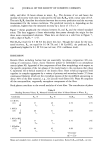
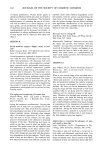
EXTENSION OF PERMED HAIR 135 R o 70 ! % 60- 50- 30- 20- 0.3 M TA J 1 M $u[fi*.e T T • Cys- HCL 1MTA / --" Figure 7. Relation between the measured and calculated recoveries R i and Ro, respectively, for the four conditions applied. The bars indicate the standard errors of the mean values. The solid line is the regression line for the three more concentrated solutions. Table I also gives the values for the length set, St, acquired by the fibers during the treatment. The length set, St, if any, is small compared to the predicted set, So. The 95% confidence limits for S t in all cases include the value zero. Table II summarizes the bending recovery values, Ri, measured for the hair rings ini- Table I Data for the Relative Static and Dynamic Forces F•/F o and AFro/AFo and the Length Set S L Measured After the Treatments Under the Various Conditions and the Recovery and Set Values, R o and So, Calculated According to Equations 16 and 2 Conditions F•/Fo AFro/AFo Ro, % So, % SL, % O.3 MTA (7) • 0.58 0.92 63 37 5 SE 0.029 0.02 o 2. 2 12. 2 MTA (6) • 0.27 0.88 30 70 SE 0.03o 0.025 2.8 M Cys-HCl (9) • 0.51 0.94 54 46 SE 0.021 0.01 o 2.1 M Sulfite (9) • 0.52 0.86 61 39 SE 0.019 0.012 2.1 9 13.1 6 7.5 17 Means and standard errors, number of determinations in parenthesis.

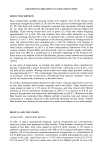
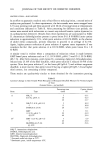
136 JOURNAL OF THE SOCIETY OF COSMETIC CHEMISTS tially, and after 16 hours release in water, R16. The decrease of set and hence the increase of recovery with time is indicated by the ratio Ri/R16 with a mean value of 0.8. The ratio Ro/Ri describes the relation between the recovery prediction and the recovery measurement for the various conditions. The predicted recovery is, depending on the conditions, higher than the measured recovery by a factor of 1.4 to 1.7. Figure 7 shows graphically the relation between R i and R0 and the related standard errors. The data suggests a linear relationship that passes through the origin for the three more concentrated solutions. These data are shown as a solid line in Figure 7, with a slope of R0/R i = 1.43. The (Ri,R0) result for 0.3 M TA lies above this line. Though the values for the mea- sured recovery, Ri, are equal for 0.3 M TA and 1 M Cys-HC1, the predicted R 0 is significantly higher for 0.3 M TA (one tail test, 95% confidence level). DISCUSSION Keratin fibers including human hair are essentially two-phase composites (16) con- sisting of continuous, linear, elastic filaments (phase C) embedded in an amorphous matrix (phase M). Appraisal of the components of hair fiber morphology with respect to the specific properties of the two phases of the model leads to the conclusion that phase C represents the or-helical material of the keratin fiber. Short or-helical segments held together in complex aggregates by a variety of primary and secondary bonds (17) form continuous filaments which are the crystalline regions of the microfibrils amounting to about 30% of the fiber material, e.g., for Lincoln wool fibers (18). Phase M comprises all the noncrystalline, supposedly amorphous components of the fiber. Both phases contribute to the overall modulus of a hair fiber. The contribution of phase Table II Bending Recovery Values, Ri, Measured Initially and After 16 Hours Release in Water, R16 Conditions R•, % R•6, % R•/R•6 Ro/R• 0.3 MTA (21) • 37 49 0.76 1.70 SE 2. 2 2. 7 1 MTA (24) • 20 31 SE 1. 7 1. 9 1 M Cys-HCI (103) • 37 47 SE 0.8 1-2 1 M Sulfite (172) • 44 45 SE 1. o 3.• O.64 1.50 0.79 1.46 0.98 1.39 i= 0.8 SE = 0.07 Means and standard errors, number of determinations in parenthesis. Ratios R•/R•6 and Ro/R •, see text.
Purchased for the exclusive use of nofirst nolast (unknown)
From: SCC Media Library & Resource Center (library.scconline.org)