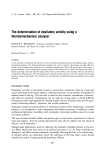
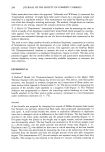
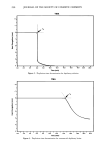
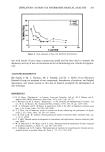
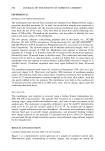
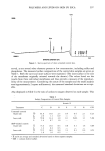
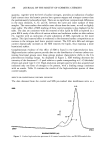
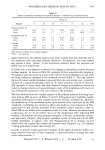
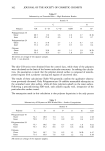
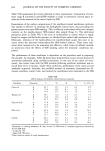
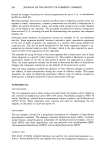
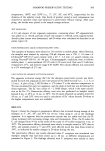
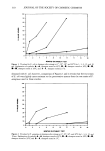
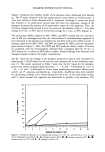
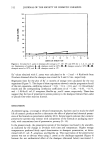
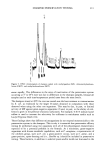
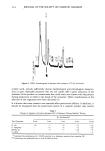
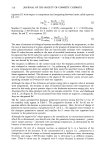
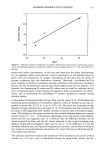
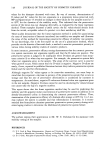
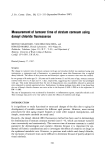
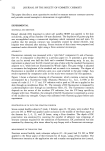
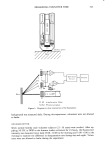
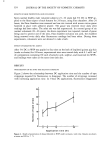
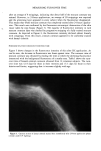
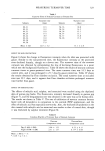
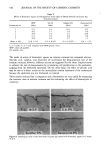
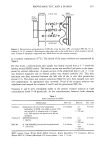
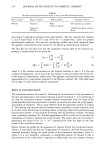
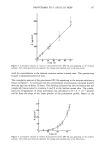
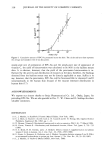
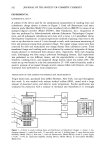
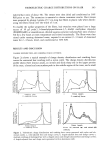
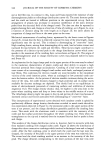
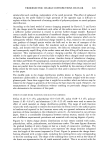
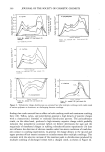
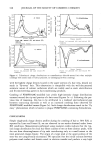
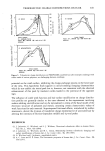
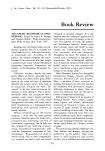
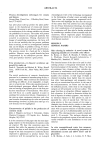
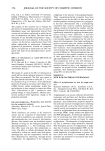
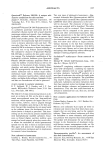
MEASURING TURNOVER TIME 325 after an average of 9 strippings, indicating that about half of the stratum corneum was stained. However, in 24-hour applications, an average of 20 strippings was required and the glistening layer appeared in every subject when the fluorescence disappeared. This means that whole stratum corneum was completely stained after 24 hours' applica- tion. This result was confirmed by the fluorescent microscopic observation of the skin tissue taken by snip biopsy (Figure 3). The equality of fluorescence intensity in each stratum corneum layer was checked by progressive stripping of a fully stained stratum corneum. As depicted in Figure 4, the fluorescence intensity declined almost linearly with strippings. From this result, stratum corneum appeared to be uniformly stained with dansyl chloride. FOREARM STRATUM CORNEUM TURNOVER TIME Figure 5 shows changes in the fluorescence intensity of skin after DC application. As can be seen, the decrease in fluorescence was linear against time. The turnover time of stratum corneum was obtained by reading the time at which the declining fluorescence intersected with the background fluorescence of a nearby area. Table I shows the turn- over time of forearm stratum corneum obtained from 14 volunteer subjects. The turn- over time was 12.9 days for those in their twenties and 15.1 days for those in their thirties and forties, suggesting that it increases slightly with age. Figure 3. Cryostat section of dansyl chloride stained skin immediately after 24-hour application (phase contrast under UV lighting).

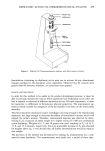
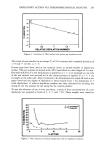
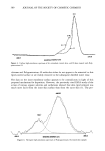
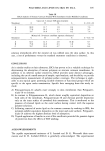
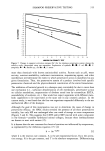
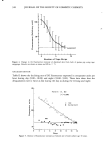
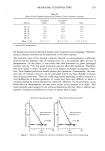
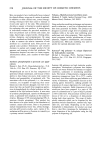
326 JOURNAL OF THE SOCIETY OF COSMETIC CHEMISTS background 0 5 10 Number of Tape Strips Figure 4. Change in the fluorescence intensity of depilated skin from back of guinea pig using tape strippings. Results are shown as mean and SD (n = 7). CIRCADIAN RHYTHM Table II shows the declining rate of DC fluorescence expressed in comparator units per hour during day (9:00-18:00) and night (18:00-9:00). These data show that the desquamation rate is twice as fast during the day as during the evening and night. 141 10( 70 0 Forearm (•, 36) Irl =0.948 0 0 0 0: test •,• ß: background O Oo• ß ee OO QQ•Q• Q QQ I I I I t I t I t I I I I I I I 6 2 4 6 8 10 12 14 1 Days Figure 5. Decline of fluorescence intensity at forearm site of male subject age 36 years.
Purchased for the exclusive use of nofirst nolast (unknown)
From: SCC Media Library & Resource Center (library.scconline.org)