36 JOURNAL OF THE SOCIETY OF COSMETIC CHEMISTS formal positive or negative charges. If the charges on the polyion and the surfactant have the same sign, then strong forces of electrostatic repulsion are involved and little to no association can be expected. Examples are NaCMC or ionized polyacrylic acid in the presence of anionic surfactants. The position is reversed in the opposite case, and in fact the polyion now presents well-defined electrostatic binding sites for the oppositely charged surfactant ions. The process is strongly reinforced by alkyl chain association of the adsorbing surfactant molecules. Examples are the interaction of alkyl sulfate surfac- tants with cationic-cellulosic or -vinyl polymers. Several properties of the polyion influence the reaction with oppositely charged surfac- tants. This is evident in the binding sequence of Kwak referred to earlier, and involves charge density, hydrophobicity, macromolecule flexibility, and other factors. The reader is referred to Kwak's papers for more detailed information. It should again be mentioned that the ability of excess surfactant to resolubilize the insoluble polymer/sur- factant complex formed under "stoichiometric conditions" also depends on the charge density and structure of the polyion. INTERACTION MODELS For both types of polymer/surfactant systems, viz., polymers charged or uncharged, theories developed to account for the formation of polymer/surfactant complexes have postulated structures with the surfactant molecules in the form of aggregates or clusters. Much information, including NMR data (referred to above) and solubilization data (referred to below), points to individual surfactant molecules experiencing an envi- ronment in the complexes similar to that which they encounter in regular surfactant micelies. In explaining their data for the SDS/PEO system, Smith and Muller (21) postulated that each macromolecule consists of a number of effective segments of mass (Ms) and total concentration (P) that act independently of each other and are able to bind n surfactant anions (D-), in a single step according to P +nD- • PDn n- with the equilibrium constant being given by K = [PDn n- ]/[P][D-]n K is obtained from the half saturation concentration, viz., K = [D- ]•/2-n The data indicated the cluster size, n, to be about 15 (which is much smaller than in regular micelies) and Ms to be 1830, which explains the experimental finding that PEO of MW 1500 is relatively ineffective for surfactant binding while higher molecular weight PEOs are effective. The free energy of binding is given by AGø= RTlnK •/n and the value obtained, viz., - 5.07 Kcal mole- •, is close to that of micelie formation. Shirahama (14) introduced a similar model to account for his binding data of SDS on PEO in the sense that cluster formation of the bound surfactant molecules (with n = 20 molecules) was invoked and the degree of binding, 0, was expressed by a modified Langmuir isotherm of the form 0 = KCn/(1 + cn).

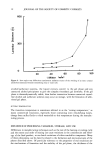
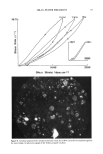
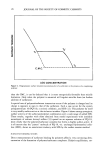
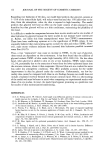
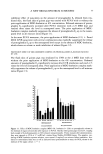
POLYMER/SURFACTANT INTERACTION 37 More complete models have been proposed recently by Nagarajan (35) and by Gilanyi and Wolfram (36). Nagarajan, for example, sets up a mass balance equation for the total surfactant in the system that includes surfactant in single ion form, in clusters of size gb in the polymer/surfactant complexes, and in micelles of size gf. Binding (Kb) and micellization (Kf) constants are also assigned. Depending on the relative values of K• and Kf, one can then either encounter complex formation followed by micellization or only micellization, and the steepness of the binding curve will be determined by the degree of cooperativity or g•. With this model, Nagarajan was able to account quantita- tively for observed binding data, while confirming the essential similarity of the pro- cesses of complex formation and of micelle formation. The picture that emerges is that these two processes are essentially competitive. If K• Kf complex formation will oc- cur until the binding process is complete, after which, on further increase of surfactant, regular micelles will form. [This would lead to phase diagrams of the type developed by Sasaki et al. (23) and other workers (28,35). See Figure 10]. Another factor supporting the similarity of the two processes comes from the fast kinetics measurements of Wyn- Jones (37-39). A surprising result is that the kinetics of aggregate formation are at least as fast as those of micellization, itself a very fast process with relaxation times in E E 2O 0•8 •12 0 I..- z I,U z o D (MICELLE) C B A (SINGLE ION) 4 8 12 16 20 24 CONCENTRATION OF SDS/mmol din-3 Figure 10. Phase diagram of PEO (0.5%)-SDS system. The concentration of the different species, viz., single ion, micelle, and polymer/surfactant complex, at any SDS concentration is obtained from the inter- cepts of a vertical line raised at that concentration (23).
Purchased for the exclusive use of nofirst nolast (unknown)
From: SCC Media Library & Resource Center (library.scconline.org)