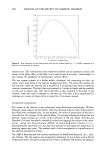
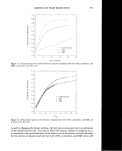
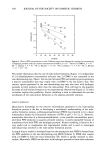
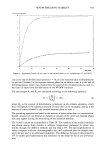
INDO-ANILINE DYE FORMATION 301 RESULTS AND DISCUSSION Although hydrogen peroxide is known as a strong oxidizing agent, without a catalyst its ability to oxidize PPD in aqueous solution at alkaline pH is very limited. As it is shown in Figure 1, at t • 30 minutes after mixing ofPPD, 2,6-DMP, and H202, the amount of indo-aniline formed accounts for less than 5% of the PPD concentration. Unlike the ferricyanide system, where the rate of indo-aniline formation is a function of the con- centrations of both PPD and phenol (2), the rate of indo-aniline formation in the aqueous hydrogen peroxide solution is essentially independent of the phenol concentra- tion. In addition, enhancement of the initial rates of indo-aniline formation by H202 can only be observed within a very narrow range of [H202] (5 X 10⁻³ M -- 1.8 X 10 -2 M). When [H202] is greater than 1.8 X 10 -2 M under the experimental conditions used, the apparent rate of indo-aniline formation (obtained from the initial slope of indo-aniline concentration profiles) is inversely proportional to [H•O•]. EFFECTS OF REACTANT CONCENTRATIONS ON RATE OF INDO-ANILINE FORMATION Three sets of indo-aniline concentration profiles obtained using different concentrations of p-phenylenediamine (PPD) and 2,6-dimethylphenol (2,6-DMP) are shown in Figure 1. As we can see, ten-time increase in concentration of 2,6-DMP results in little increase in the rate of indo-aniline formation (from circles to squares). However, the rate of indo-aniline formation is proportional to PPD concentration. An increase in PPD 1.2 1.0 0.8 • 0.6 .•_ -- '•= o 'o 0.4 0.2 03,:9,:9000 i i I 50 100 150 Time / Min. 0.0 • 0 200 250 Figure 1. Plots of concentrations of indo-aniline obtained using three different experimental conditions: O, [PPD] = 9 X 10 -5 M, [2,6-DMP] = 9 X 10 -5 M, [H202] = 1.8 X 10 -2M, pH = 9.2 [•, [PPD] = 9 X 10 -5 M, [2,6-DMP] = 9 X 10 -4 M, [H202] = 1.8 X 10 -2 M, pH = 9.2 and A, [PPD] = 9 X 10 -4 M, [2,6-DMP] = 9 X 10 -4 M, [H202] = 1.8 X 10 -2 M, pH = 9.2.

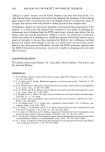
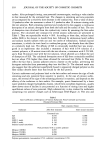
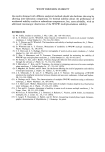
302 JOURNAL OF THE SOCIETY OF COSMETIC CHEMISTS concentration by the same amplitude leads to a significant increase in indo-aniline concentration (from circles to triangles). The effect of [H202] on the rate of indo-aniline formation was studied in deaerated solution to minimize the influence of atmospheric oxygen. Buffer solution used for this purpose was degassed using freezing pumping-thaw-pumping cycles in an acetone/dry ice bath. Two different types of concentration curves for indo-aniline formation were observed as [H202] increases shown in Figure 2: (a) at low [H202], concentration profiles of indo-aniline formation are linear and their initial slope increases with [H202] (down triangles and up triangles), and (b) at high [H202], concentration profiles of indo-aniline are nonlinear. After a brief linear accumulation of indo-aniline concentra- tion, the curvature of the concentration profile starts to increase as a function of time and of [H202] (squares and circles in Figure 2). Clearly, hydrogen peroxide plays two opposite roles in indo-aniline formation. Under fixed concentration of PPD and 2,6- DMP, low [H202] will result in a slow formation of indo-aniline, and consequently, the small amount of indo-aniline will be formed within the observation time. Therefore, indo-aniline consumption by secondary reaction will be negligible. At this stage, only indo-aniline formation is the dominant process in the reaction system, and the concen- tration profiles observed will linearly accumulate with time. As [H202] is increased, both the rates of indo-aniline formation and the rates of the secondary consumption reactions of indo-aniline are increased. Therefore, the experimental concentration pro- files obtained are the result of the indo-aniline formation process and its secondary reactions. Decomposition of the indo-aniline by hydrogen peroxide under our experimental con- ditions is insufficient to cause the observed peroxide concentration effect on indo- 0.30 0.25 0.20 o =• o.15 ._ _c 0.10 0.05 0.00 • 0 80 100 Time/Min. Figure 2. Plots of indo-aniline concentrations vs time. Four plots shown in this figure represents indo- aniline concentration profiles obtained at four [H202] under the fixed concentration of [PPD] = 1.9 X 10 -4 IV[, [2,6-DMP] = 2.9 X 10 -4 M, and constant pH = 9.2. W, [H202] = 5.3 X 10 -3 M F], [H202] ---- 3.5 X 10 --2 M /•, [H202] ---- 1.8 X 10 -2 M O, [H202] ---- 7.0 X 10 -2 M.
Purchased for the exclusive use of nofirst nolast (unknown)
From: SCC Media Library & Resource Center (library.scconline.org)