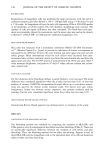
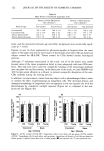
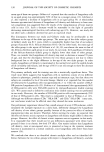
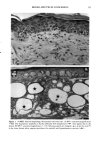
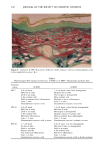
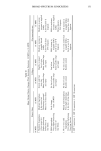
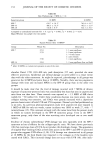
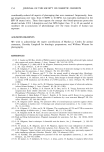
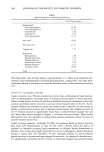
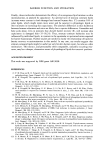
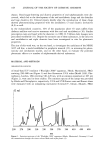
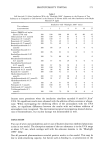
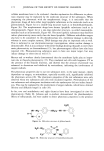
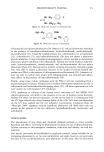
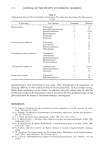
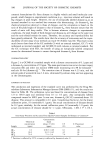
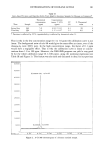
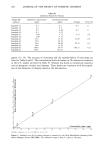
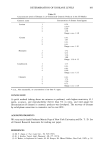
180 JOURNAL OF THE SOCIETY OF COSMETIC CHEMISTS cosmetic formulations (8). Since dioxane is a highly volatile and small molecular com- pound, small changes in experimental conditions (e.g., injection volume) will result in big changes in peak height. However, the use of isotopically labeled dioxane-d 8 as an internal standard in our method has overcome this shortcoming. As dioxane-d 8 has chemical properties identical to those of dioxane, and the calculation is based on the ratio of the peak height of dioxane to that of dioxane-d 8, these features ensure that the result of ratio will keep stable. This is because whatever changes in experimental conditions, the peak height of both dioxane and dioxane-d 8 will change in the same way and the ratio should remain the same. Therefore, the accuracy and reproducibility has been greatly enhanced. The results show that the accuracy of intra-assay and the repro- ducibility of inter-assay of our method can reach 5% (Tables I and II). This result is also much better than those of the GC methods (5) with an external standard, GC (7) with isobutanol as internal standard, and GC/MS (9) with toluene as internal standard. For the GC technique with FID, the benefit of using an isotopically labeled compound cannot be determined because it cannot distinguish dioxane-d 8 from dioxane. CHROMATOGRAPHY Figure 2 is a GC/MS of a standard sample with a dioxane concentration of 0.1 ppm and a dioxane-d 8 concentration of 10 ppm. The mass spectrometer was set at electron impact ionization (El) and select ion monitor (SIM) mode monitoring m/z 88 for [dioxane] + and m/z 96 for [dioxane-d 8] +. The retention time of dioxane was 4.23 min, and the solvent peak of acetonitrile was 3.6 min, eliminated by solvent delay and not appearing in the chromatogram. SUMMARY OF RESULTS The calculation and regression of the standard curve was performed by the Drug Me- tabolism Laboratory Information Manager System (DM-LIMS) (11), and the results are listed in Table III. The calibration curve was linear for concentrations of dioxane from 1.0 to 100.0 ppm and nonlinear from 0.1 to 1.0 ppm. Any isotopically labeled compound cannot be 100% pure. In our case, dioxane-d 8 (98.5%) contained about 1% dioxane. This amount is comparable to 0.1 ppm. Considering this factor, for the lowest calibration point, S 1 (nominally 0.1 ppm), the actual concentration of dioxane should be 0.2 ppm similarly, for the second calibration point, S2 (nominally 1.0 ppm), the actual concentration of dioxane should be 1.1 ppm. Obviously, 1.0/0.1 • 1.1/0.2. Table I Intra-Assay Precision and Accuracy From Quality-Control Samples for Dioxane in Cosmetics* Sample Concentration Theoretical found concentration (mean -+ S.D.) CV % Theoretical (ppm) (ppm) (%) value QC L 1.0 0.98 + 0.09 9.1 98 QC M 10.0 9.9 + 0.45 4.5 99 QCx_x 75.0 71 + 5.4 7.6 95 * Precision is reflected by CV% accuracy is reflected by theoretical value %.

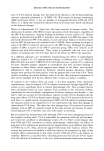
DETERMINATION OF DIOXANE LEVELS 181 Table II Inter-Assay Precision and Reproducibility From Quality Assurance Samples for Dioxane in Cosmetics* Theoretical Concentration concentration (mean - S.D.) CV % Theoretical Time Sample (ppm) (ppm) (%) value Second day QA 5.0 4.94 - 0.31 6.3 99 6 Third day QA 5.0 5.17 - 0.27 5.2 103 6 * Precision is reflected by CV% reproducibility is reflected by theoretical value %. That is why in the low concentration range (0.1 to 1.0 ppm) the calibration curve is not linear. The background noise of m/z 88 would give the same effect at times, even if the dioxane-d 8 were 100% pure. In the high concentration range, the factor of 0.1 ppm would have a negligible effect. That is why the calibration curve is linear at concen- trations from 1.0 to 100 ppm. However, the DM-LIMS program can yield a very good fit for the whole calibration range (0.1-100 ppm), using the nonlinear regression (see Table III and Figure 3). This feature was also used and discussed in detail in our previous •bundance 50000 45000 40000 35000 30000 25000 20000 15000 10000 5000 dioxane-D8 m/z=96 dioxar. m/z=S S 0 Time-- '' '4.'00''' '4.'20''' '4.'40 .... 4.'60 ' ' ' '4.'80 .... 5.i00 .... ' Figure 2. A GC/MS chromatogram of a dioxane standard sample.
Purchased for the exclusive use of nofirst nolast (unknown)
From: SCC Media Library & Resource Center (library.scconline.org)